Client Site GLD Portal
A global logistics and distribution portal providing data visibility and analytics for global supply chain customers.

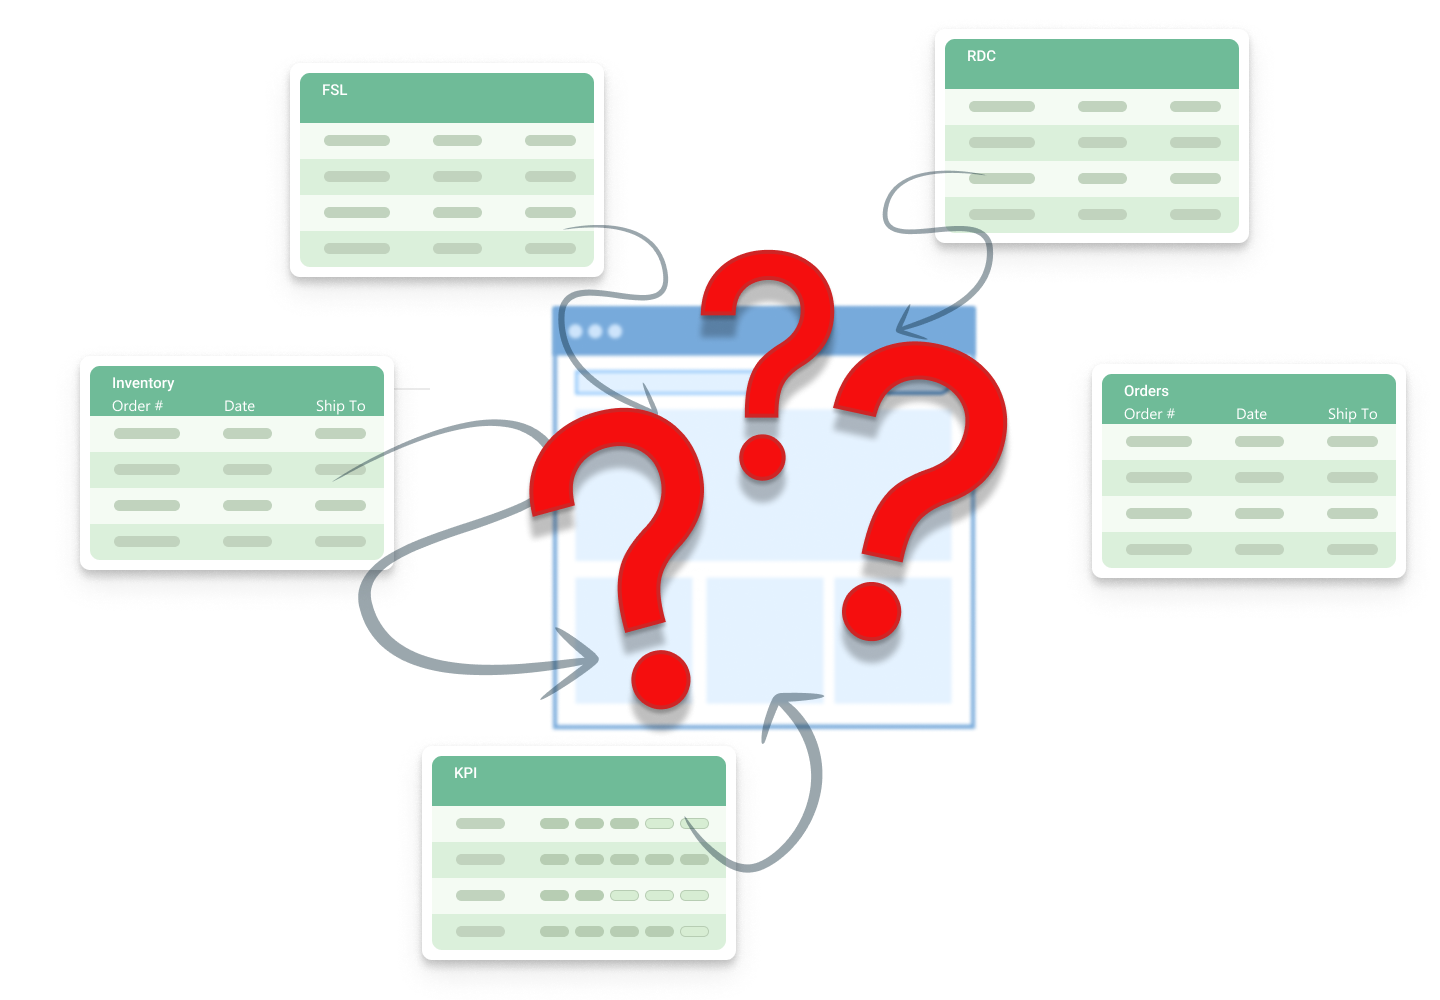
Problem
Customers expressed frustration over the lack of a singular visibility tool that connects to their entire business, presenting real-time data.
My Role
My responsibility was to design an application where our customers could manage their logistics within our warehouse operation.
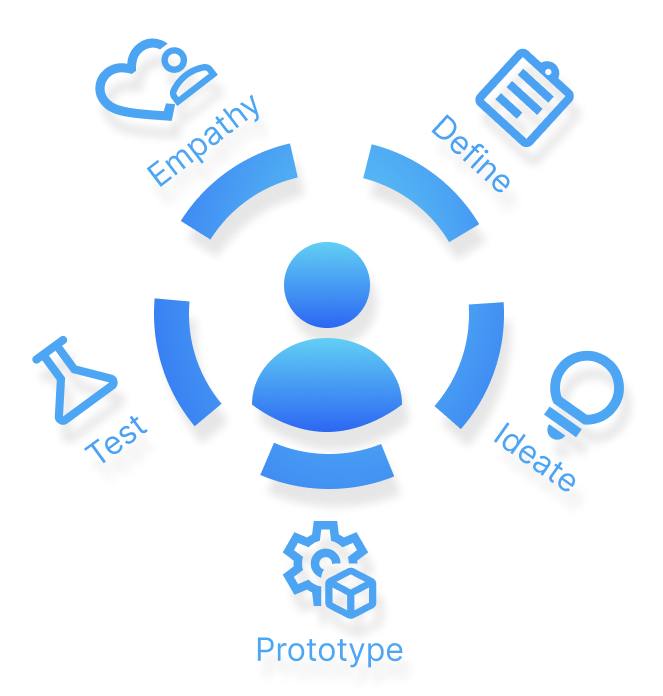
Understanding the User
I needed to identify the key users, their needs, current journey, and pain points in using UPS services. Leveraging these insights, I aimed to create a solution improving user experience and opening new revenue streams for UPS customers.
Meeting our Key Users
Lets understand who will be using the application, what are their roles, how would our tool help them in their role, what will motivate them to use our tool, and what frustrates them the most when they currently operate with us?

Tye Duncano
Director of Supply Chain Architecure
Goals
Tye aims to strategically design supply chain systems aligned with company objectives
Motivation
Tye's drive for innovation and pride in leadership motivate her to implement concrete enhancements in supply chain operations.
Pains
Tye often struggles with viewing processes across different business functions and geographical regions due to the lack of infrastructure

Deb Harn
Process Analyst
Goals
Deb's main goal is optimizing the flow of goods, ensuring precise tracking, and timely delivery to end consumers.
Motivation
She is motivated to boost performance by improving data visibility and analytics in her global supply chain.
Pains
Deb often struggles with data silos and lack of real-time visibility in the supply chain. She also faces challenges with tracking shipments and ensuring on-time delivery.

Andrew Flocka
Distribution Manager
Goals
Andrews main goal is to ensure operations have accurate inventory and make sure orders are fulfilled ontime.
Motivation
Andrew is motivated by operational excellence and ways he can automate areas in the warehouse.
Pains
Andrew often struggles with resource constraints and tight fulfillment deadlines that make it hard to upload reports during operation hours
Lets take a journey with our users
Now that I know who the users are, lets see how they us to conduct their business
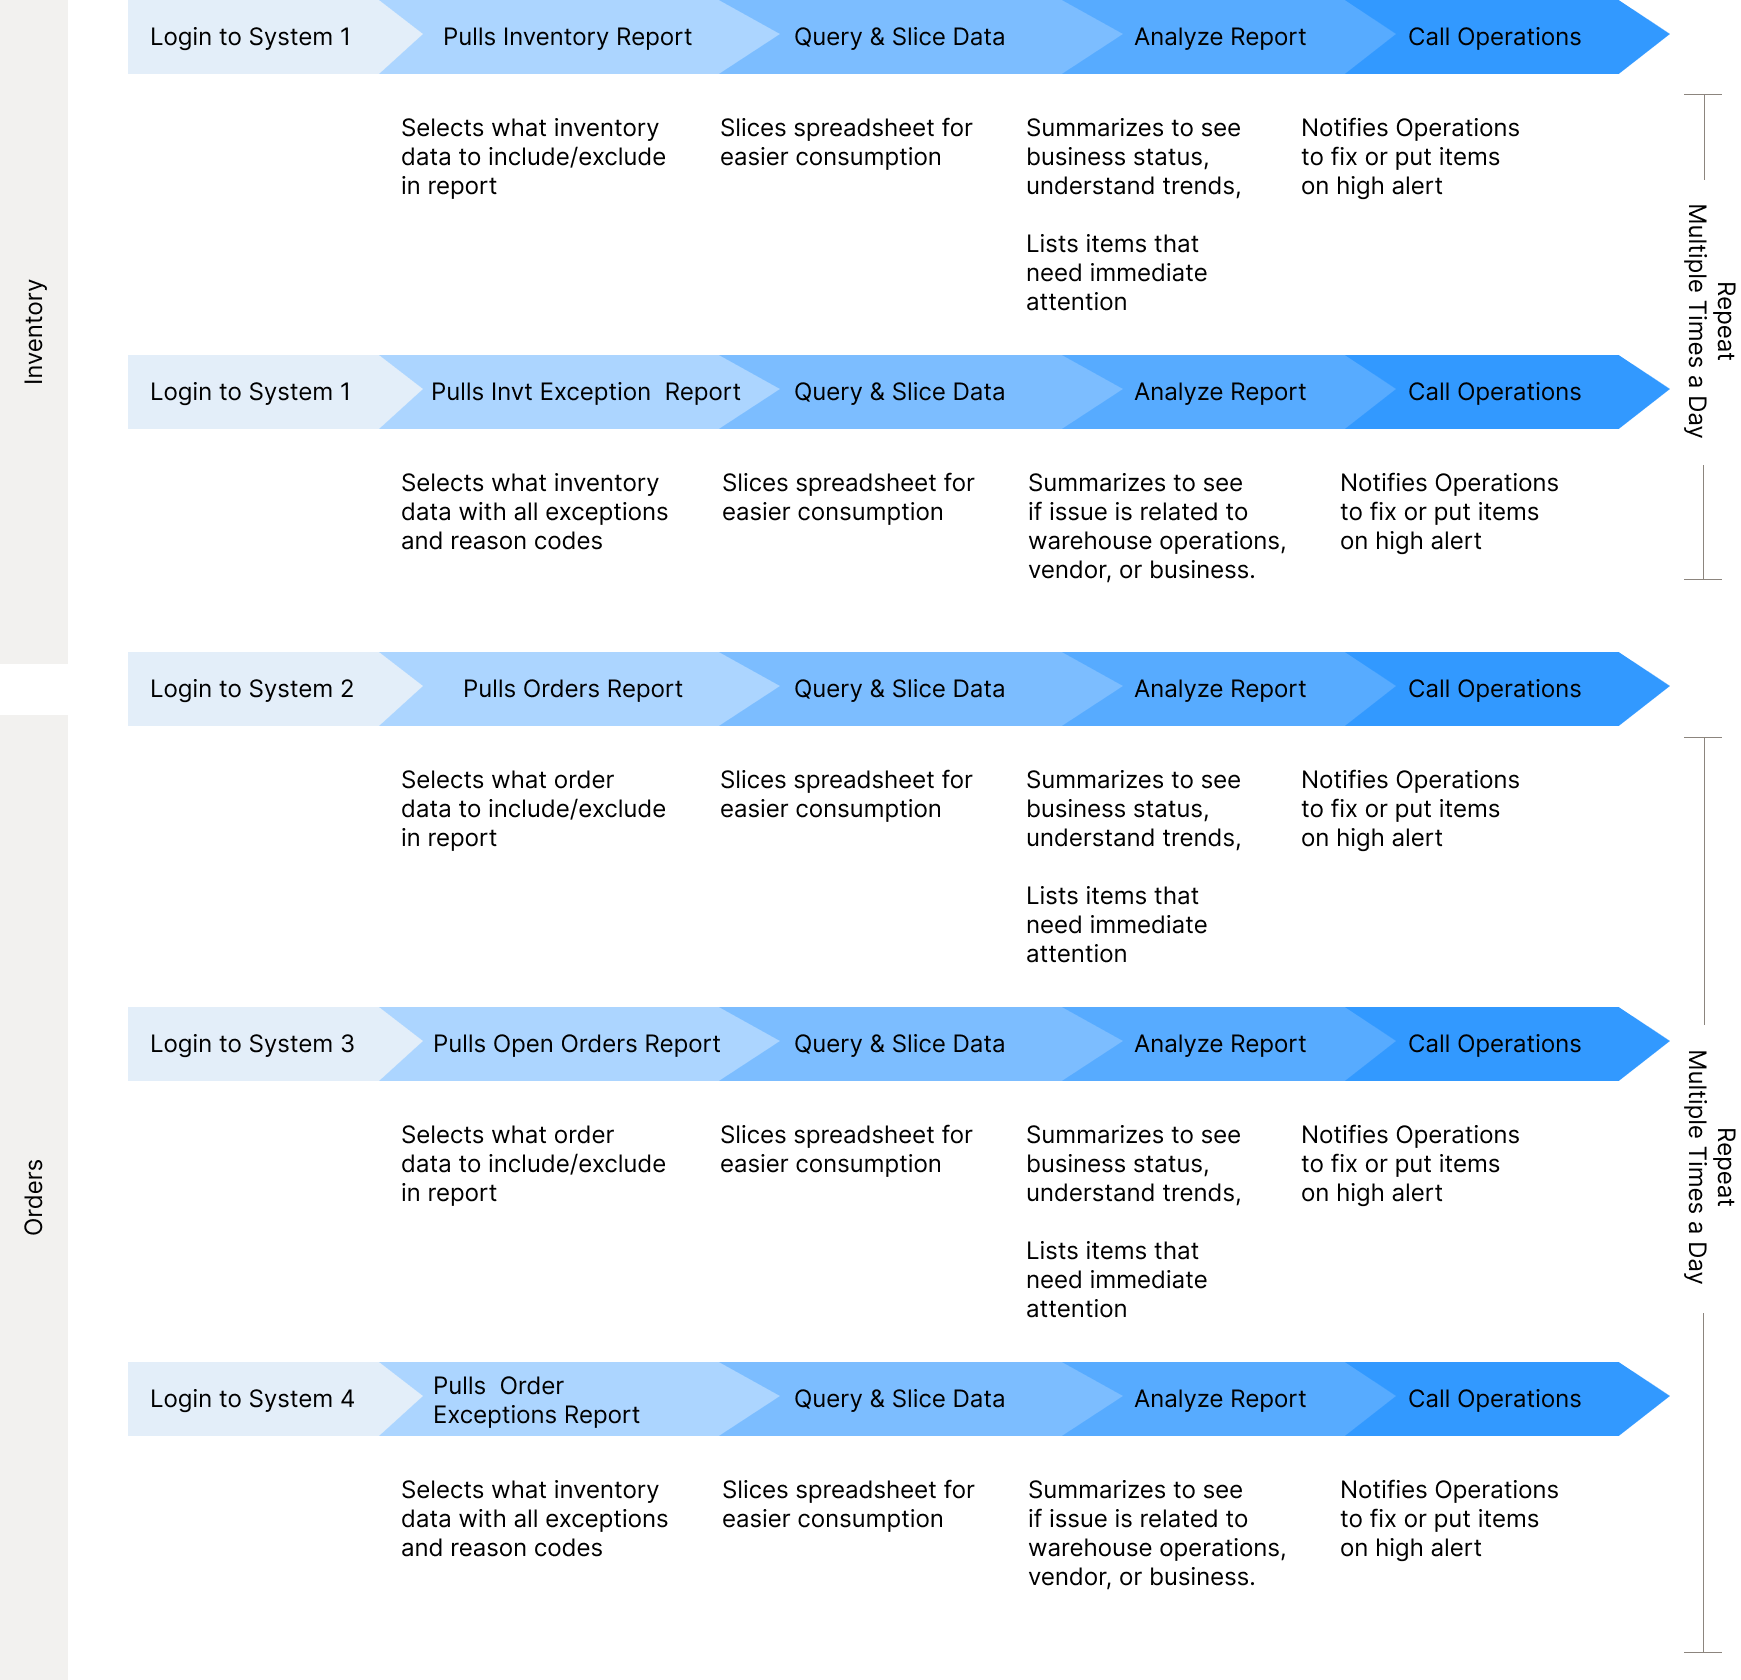
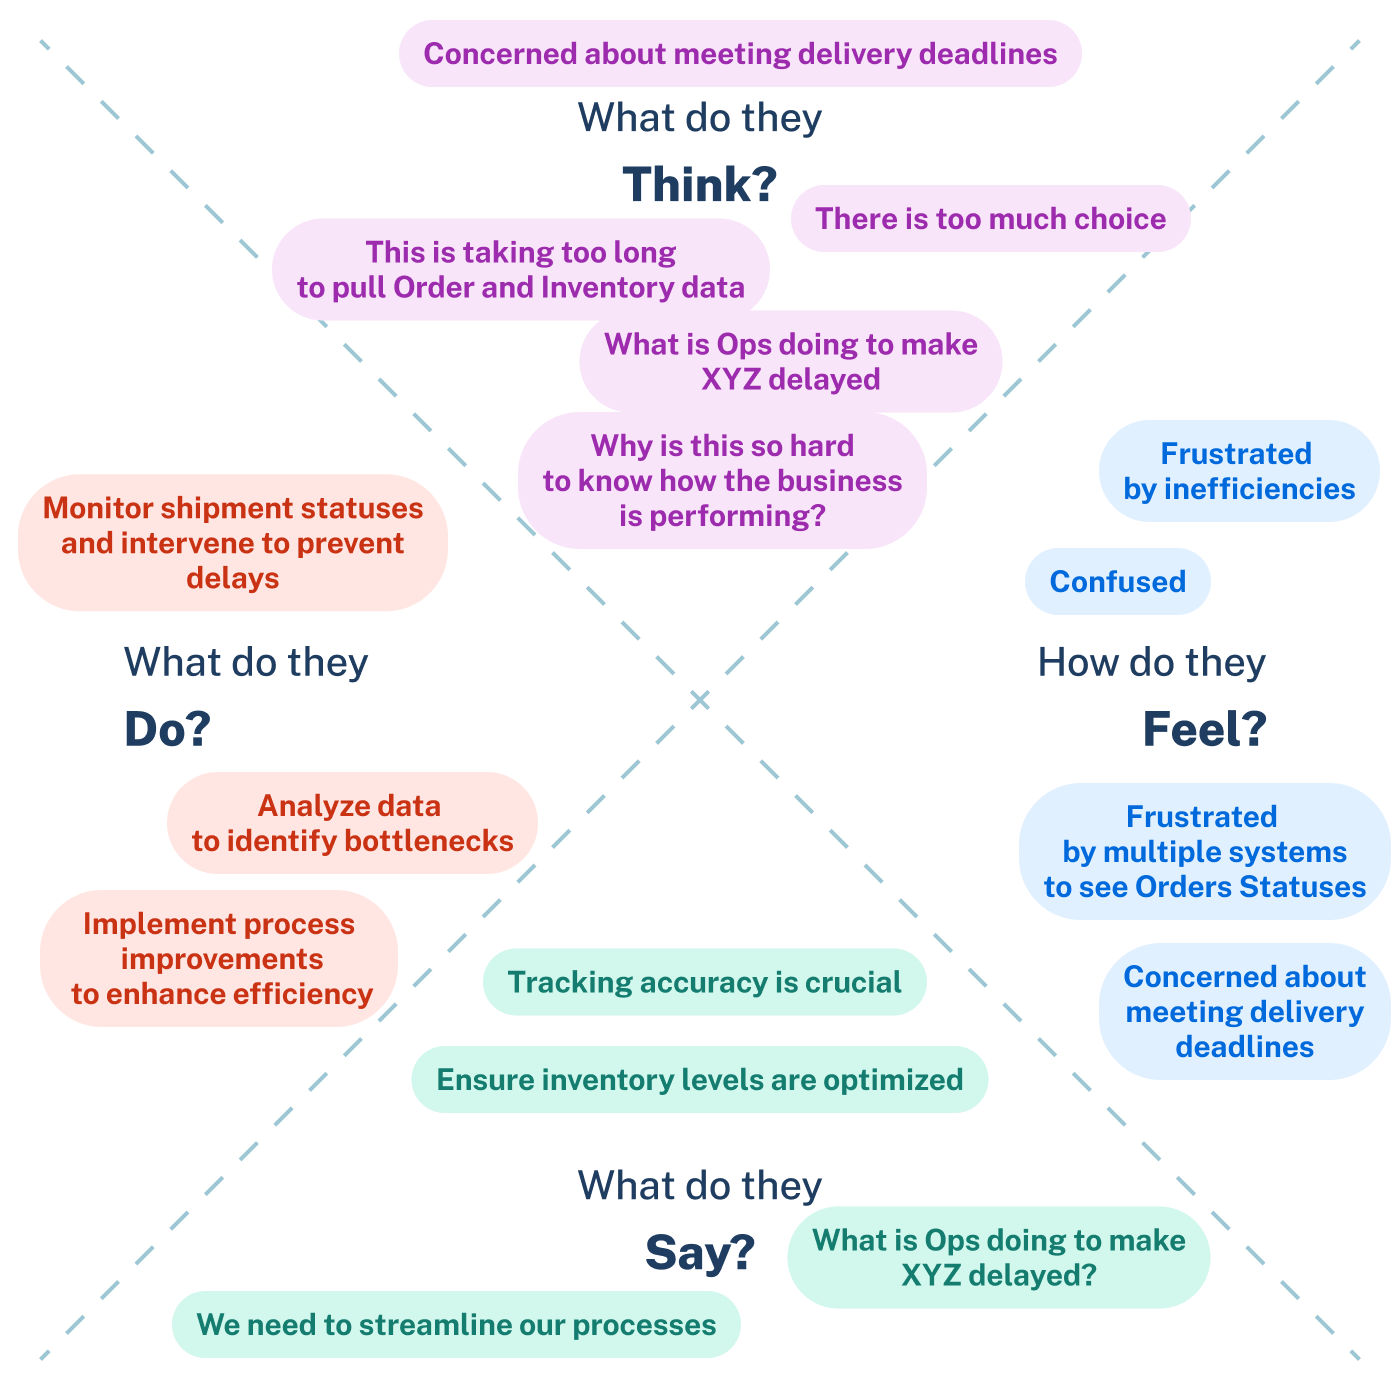
Feel what they are feeling
As they go through, I note their what they are doing, saying, thinking, and feeling.
Key Take Aways
We learned that
- They have to login to multiple systems, pull and slice several reports, create a master report just to see their Orders and Inventory
- Miss critcal issues because operations the time it takes to get the reports, the order has already failed its SLA
- Cant trust our systems to get correct inventory count
- Frustrated that their data isnt streamlined to successfully and confidently make business decisions
Solution
Create one platform that allows UPS Customers to easily see their inventory levels, manage orders, predict potential problems, and make strategic decisions to improve their supply chain operations.
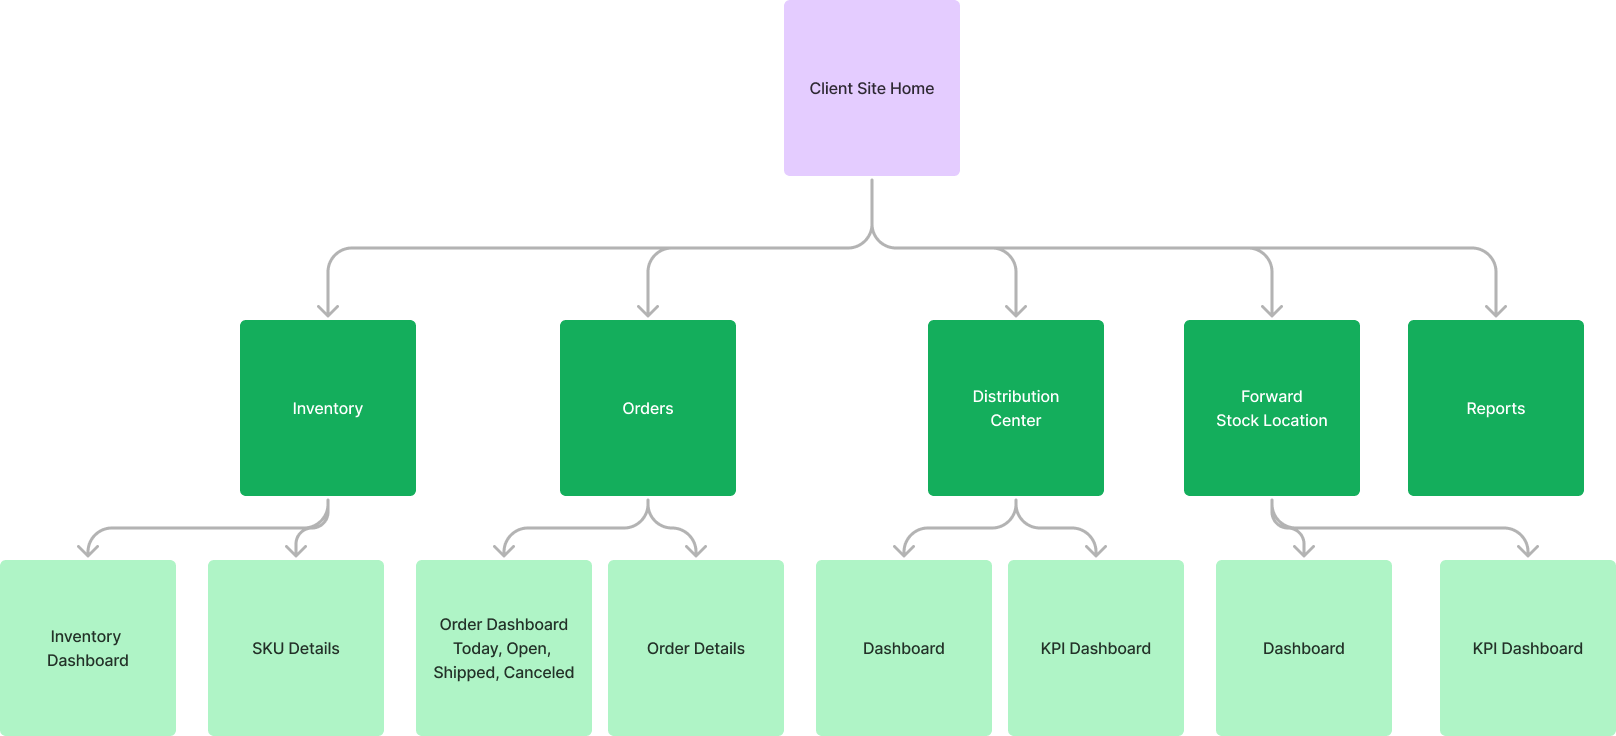
Feature and Sitemap
Now that we know what the problems are, we can define what features we need and how the site structure
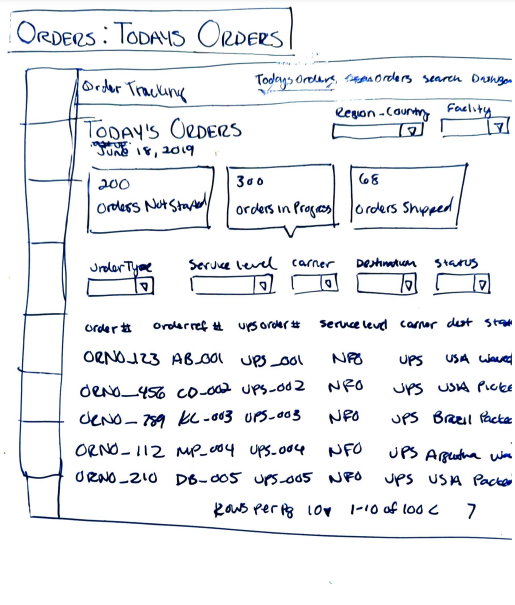
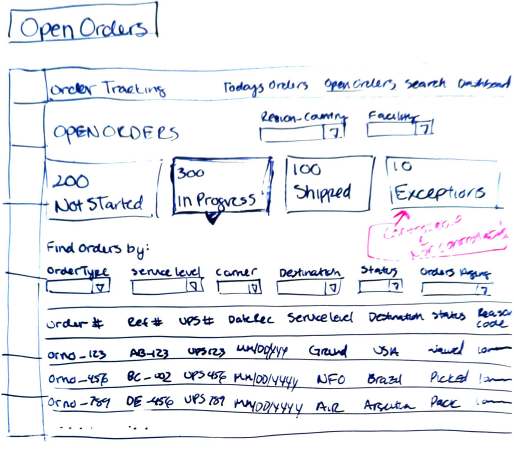
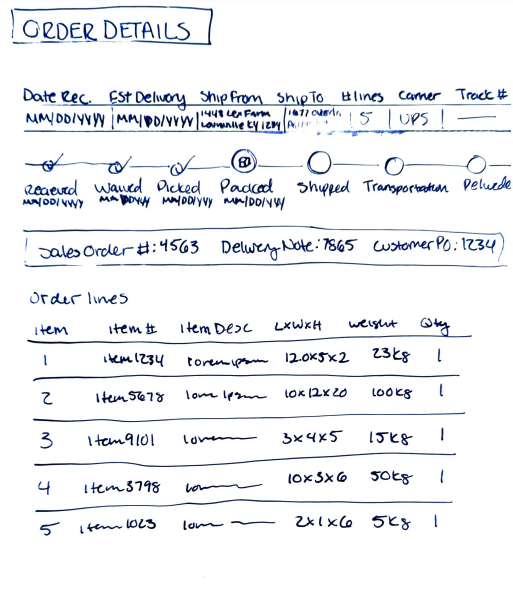
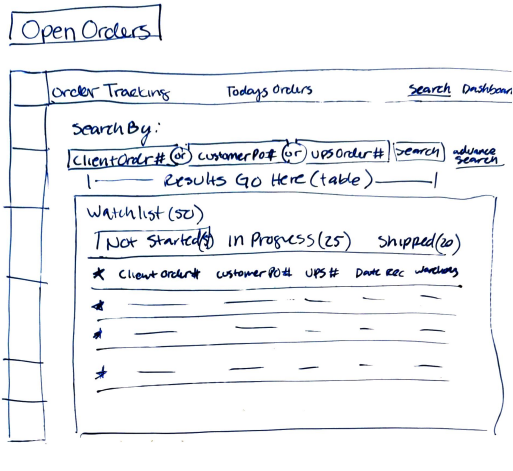
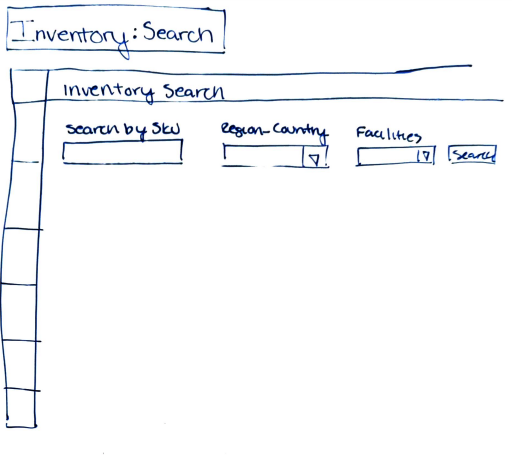
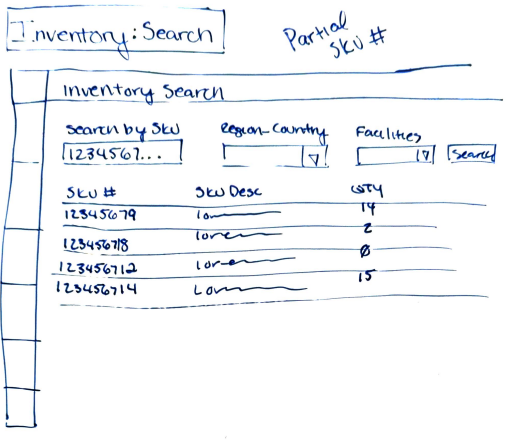
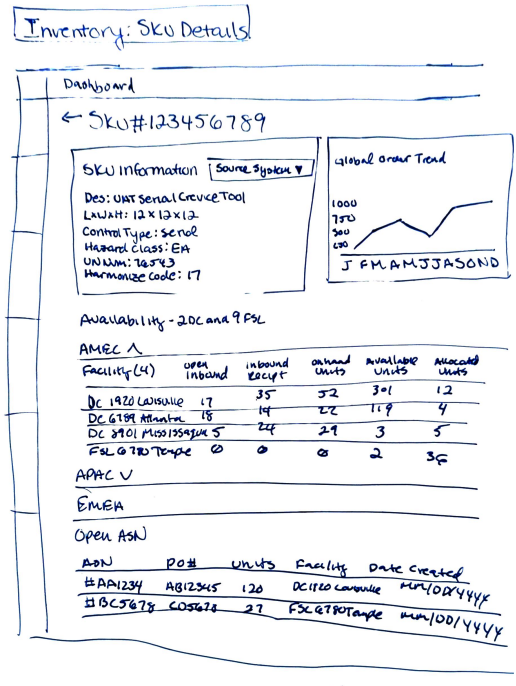
Sketches
High level sketches of the pages to present to the user for feedback and approval
Inventory
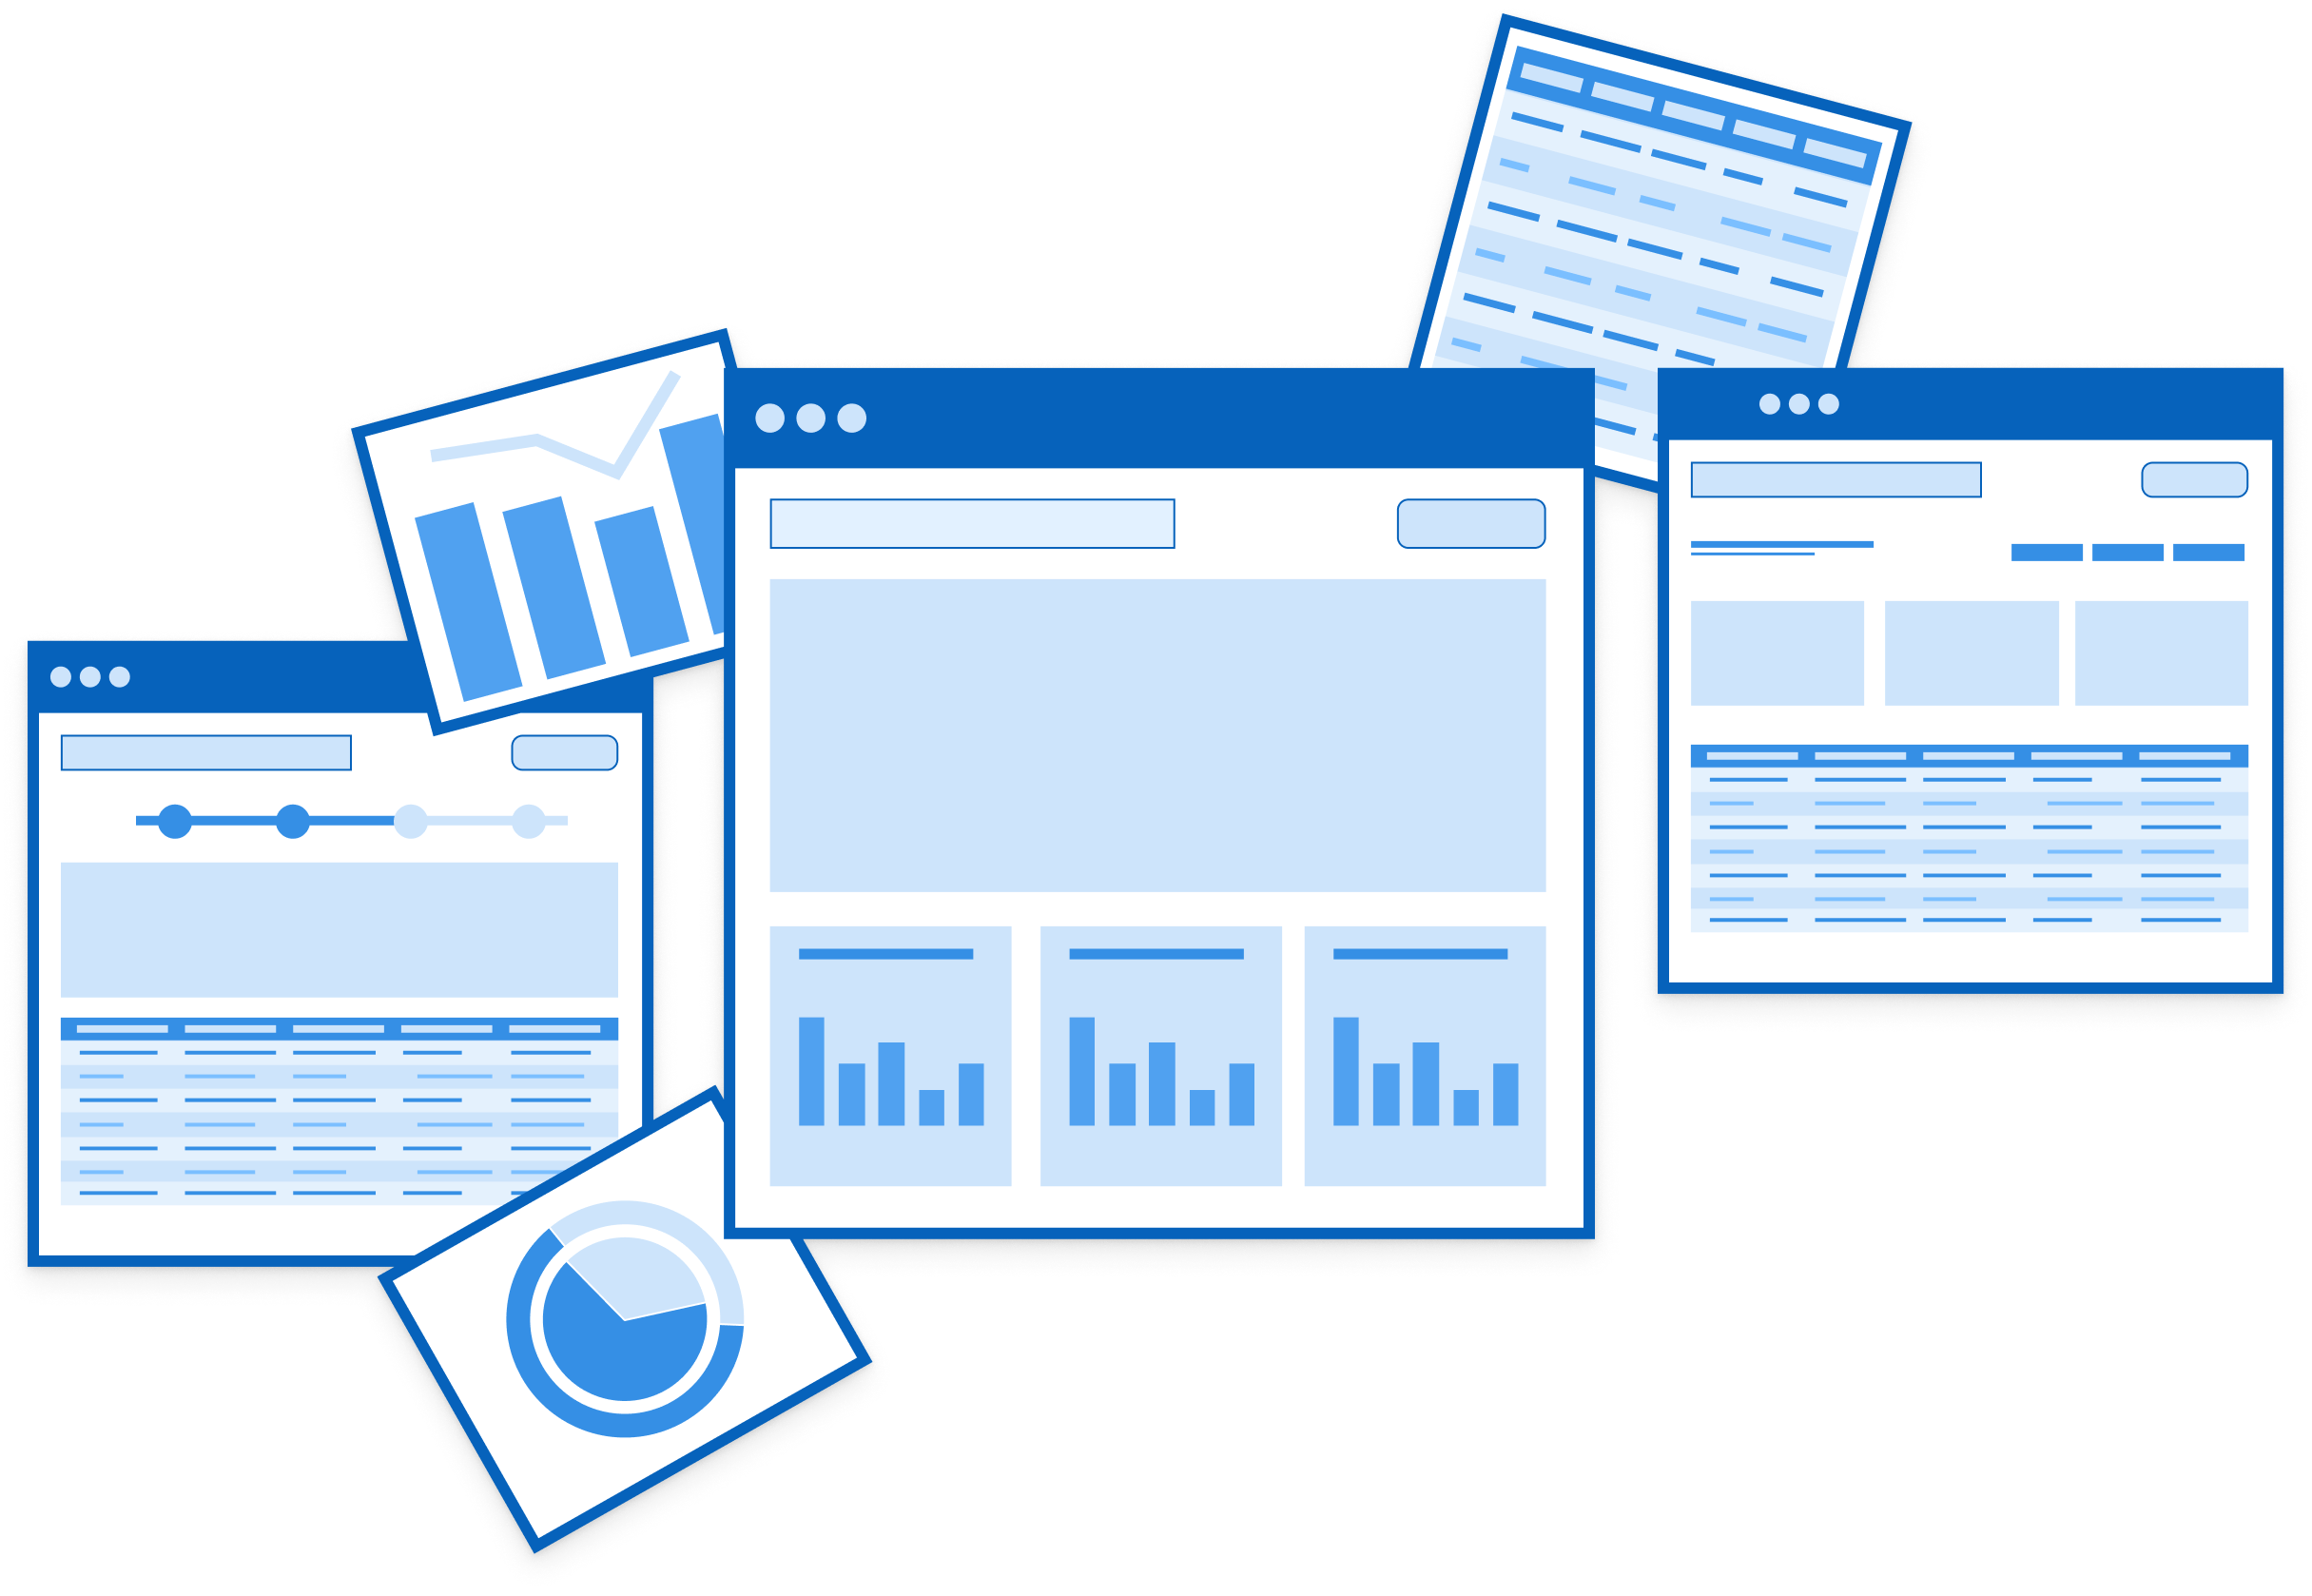
WireFrames
Time to turn my sketches into High Fidelity Wireframes
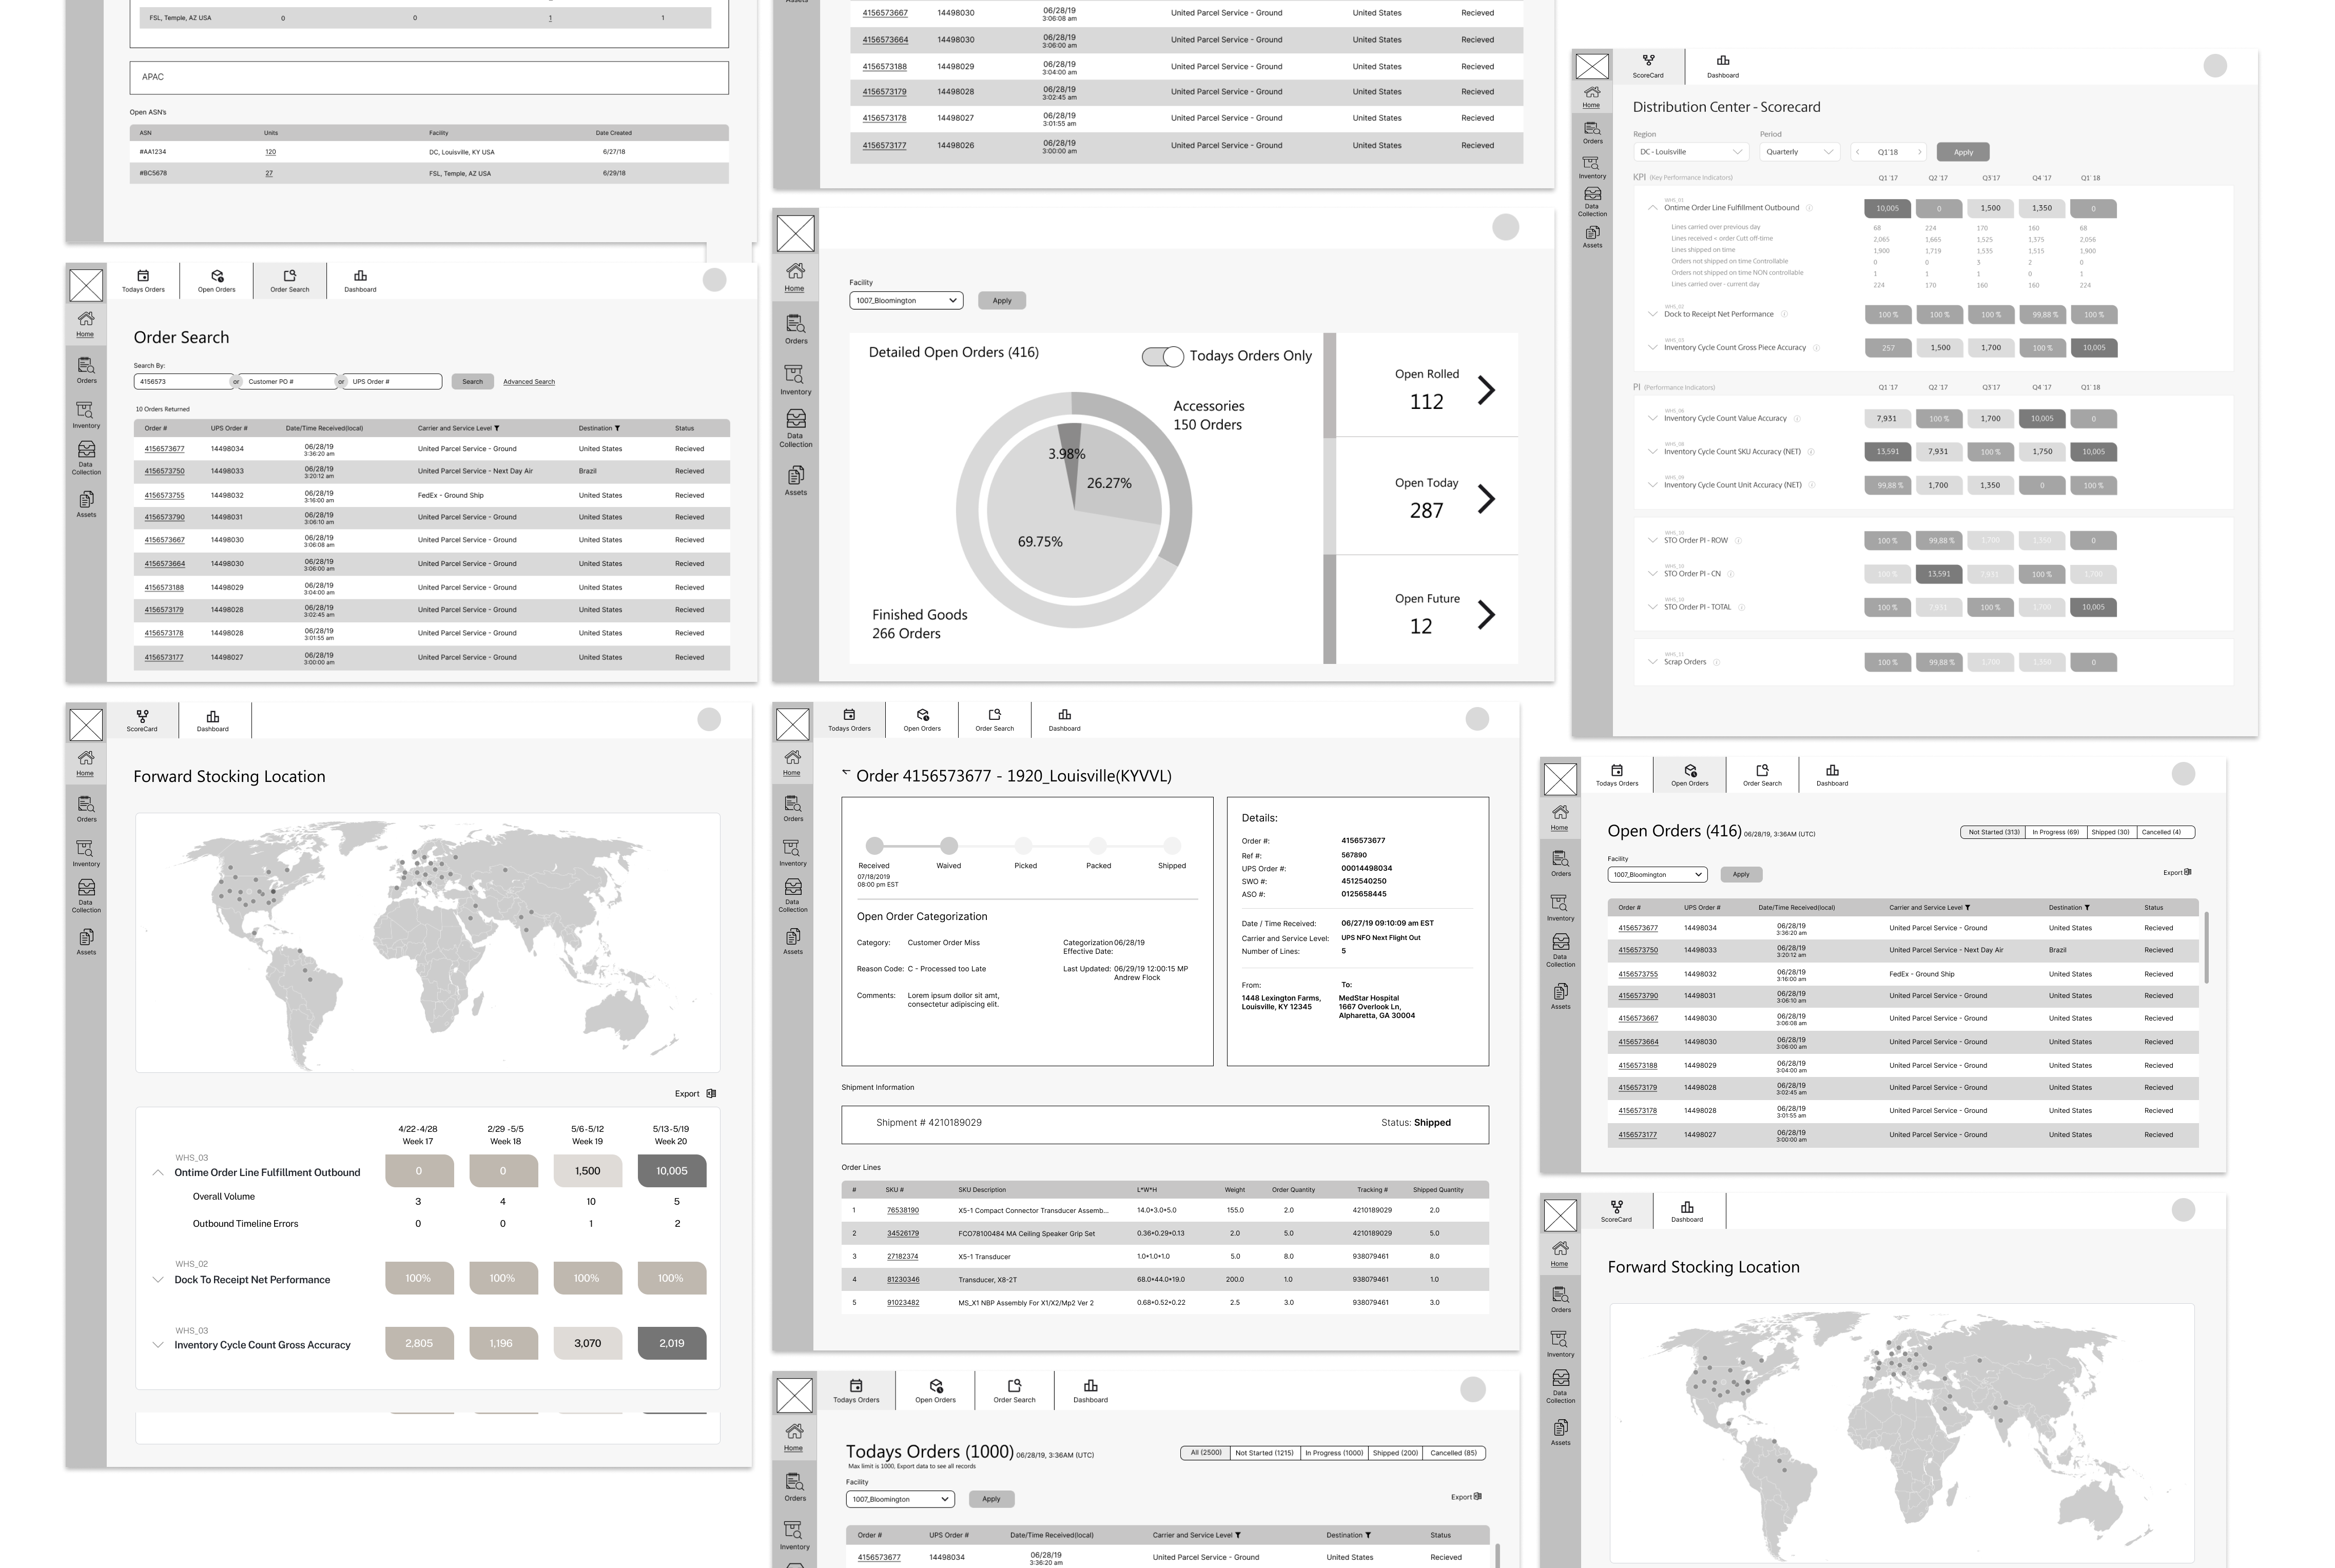
The Final Designs
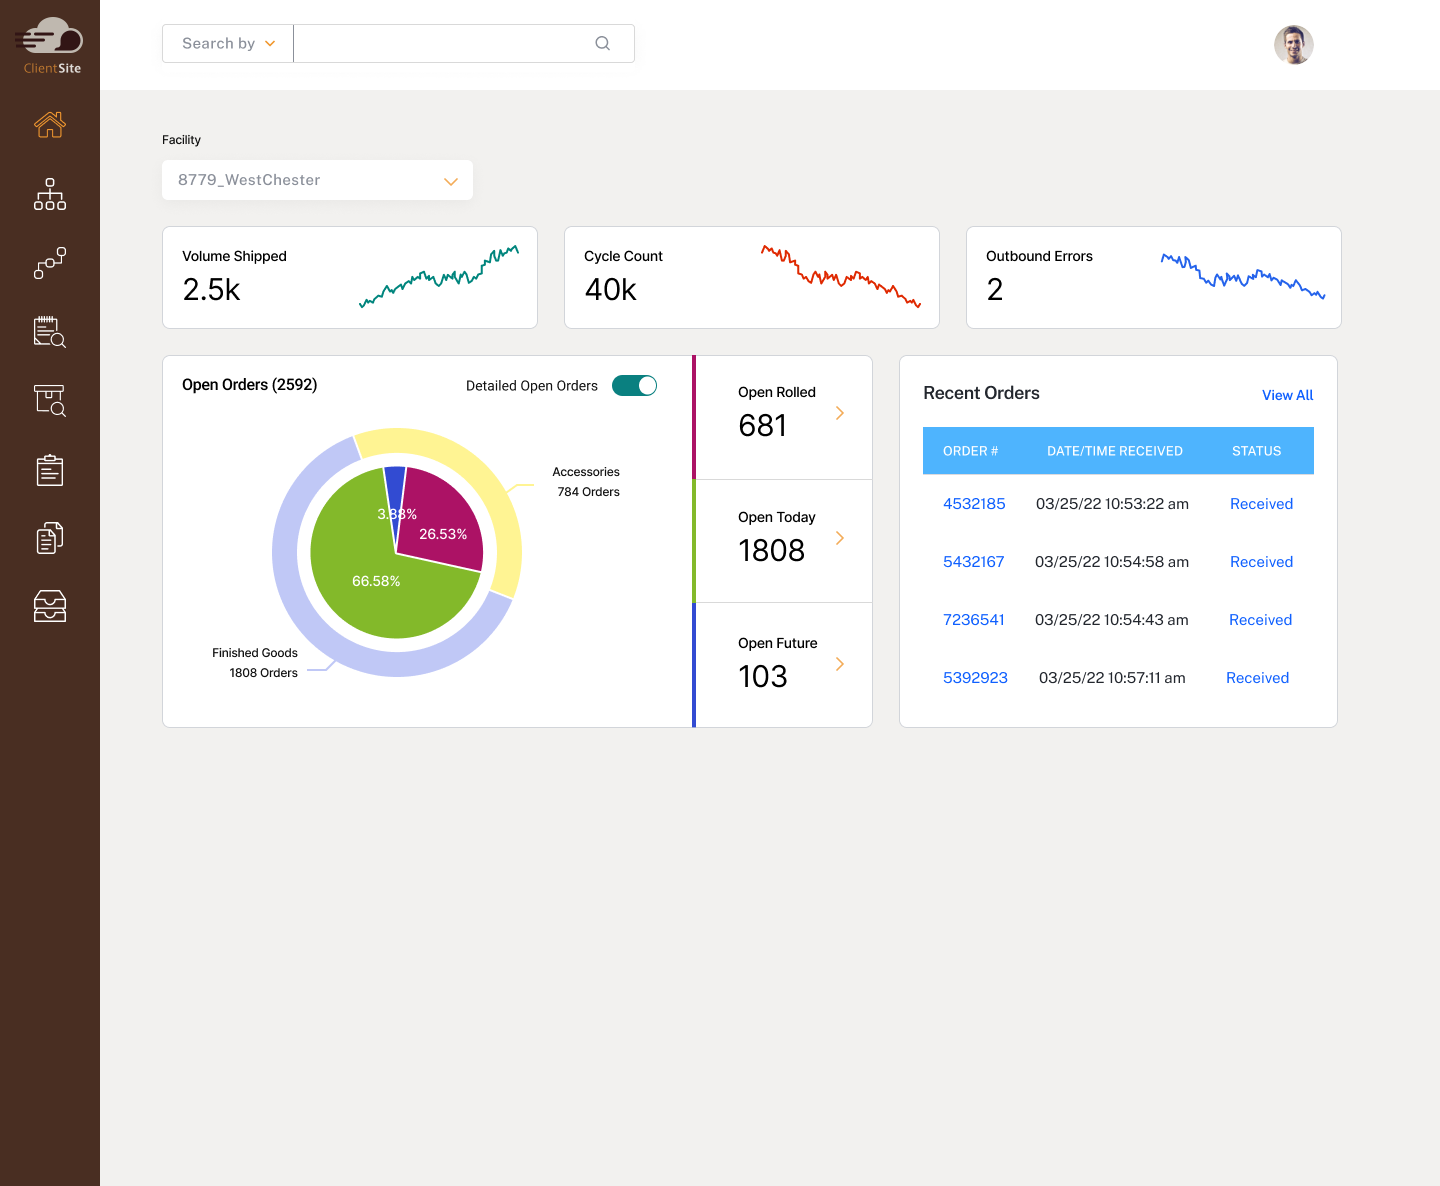
Landing Page
Dashboard Overview
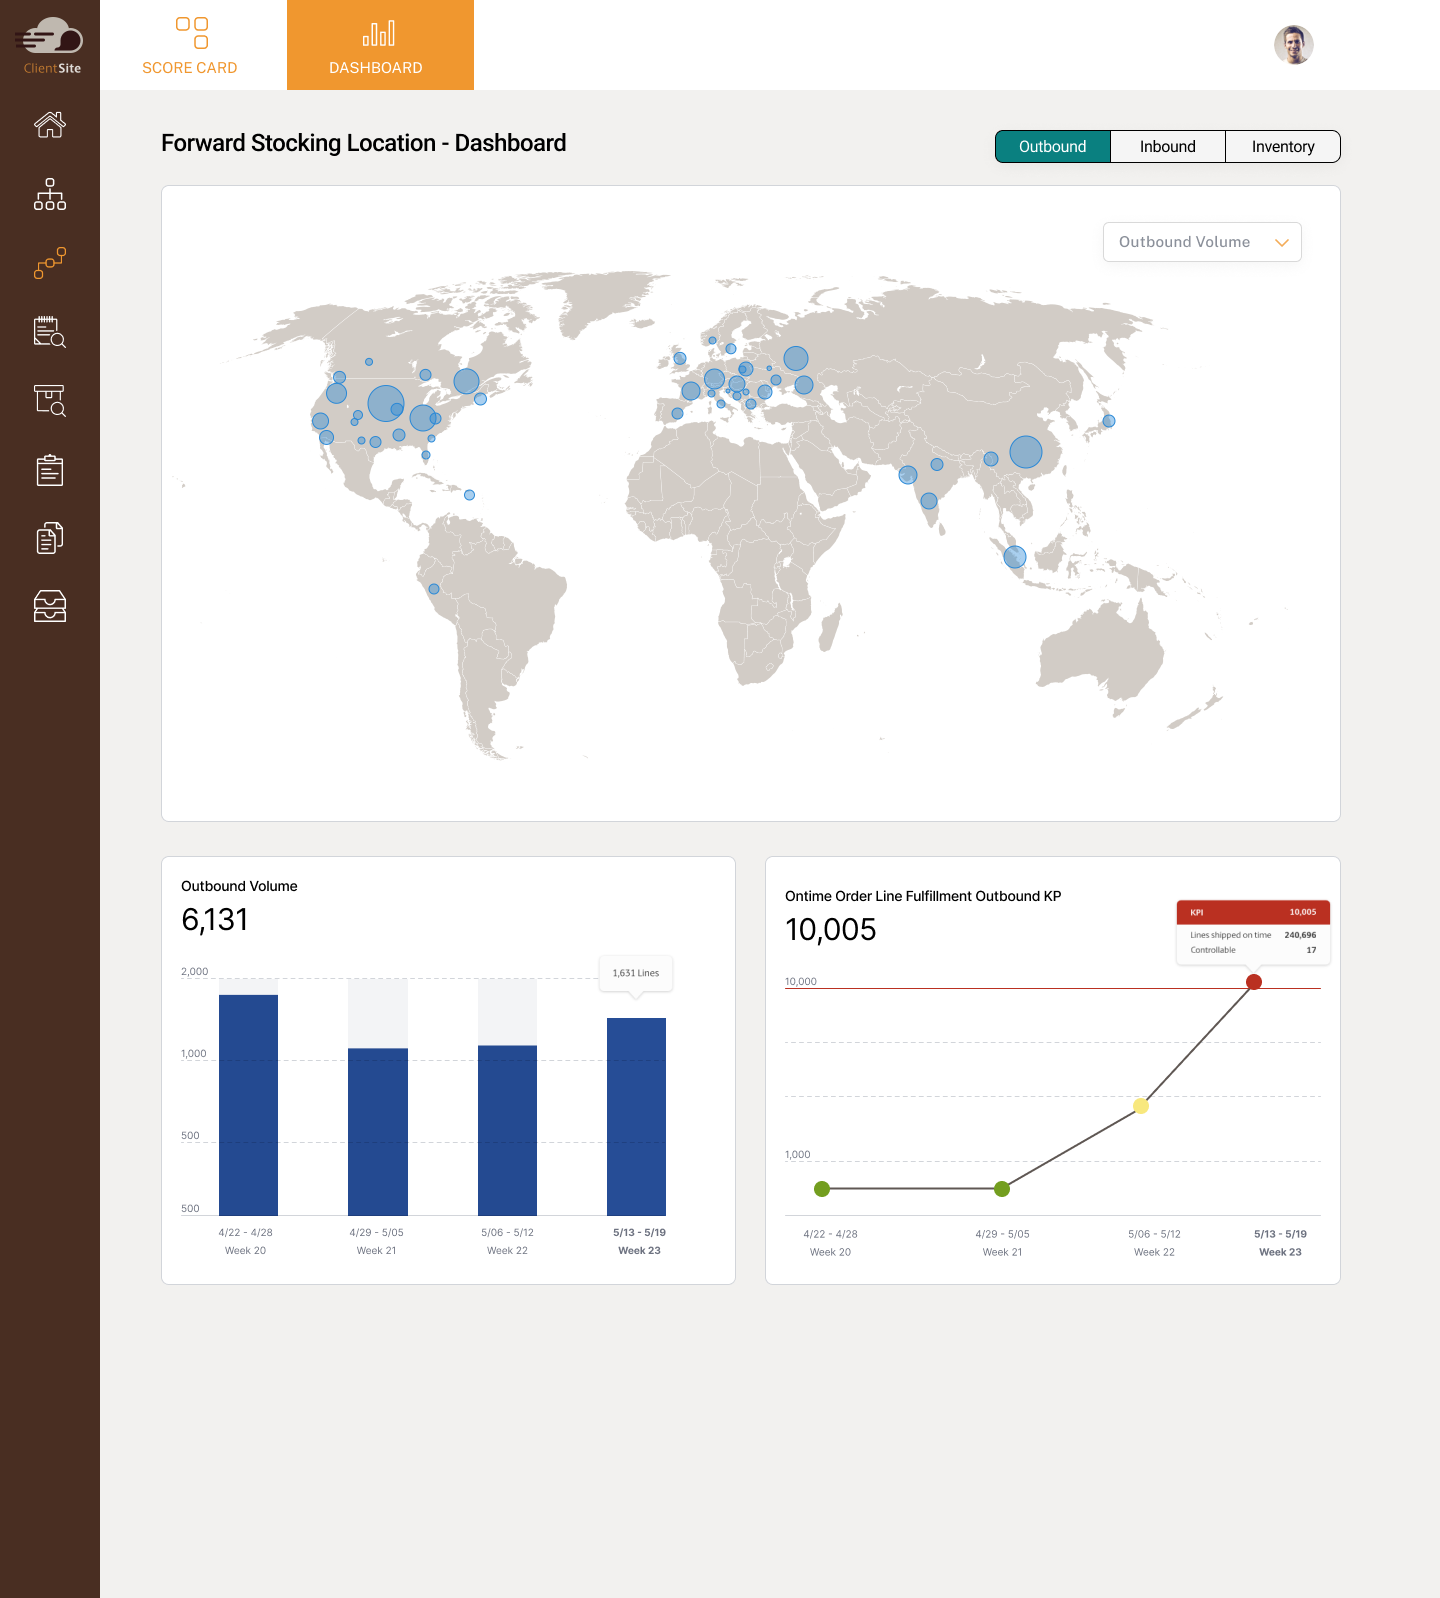
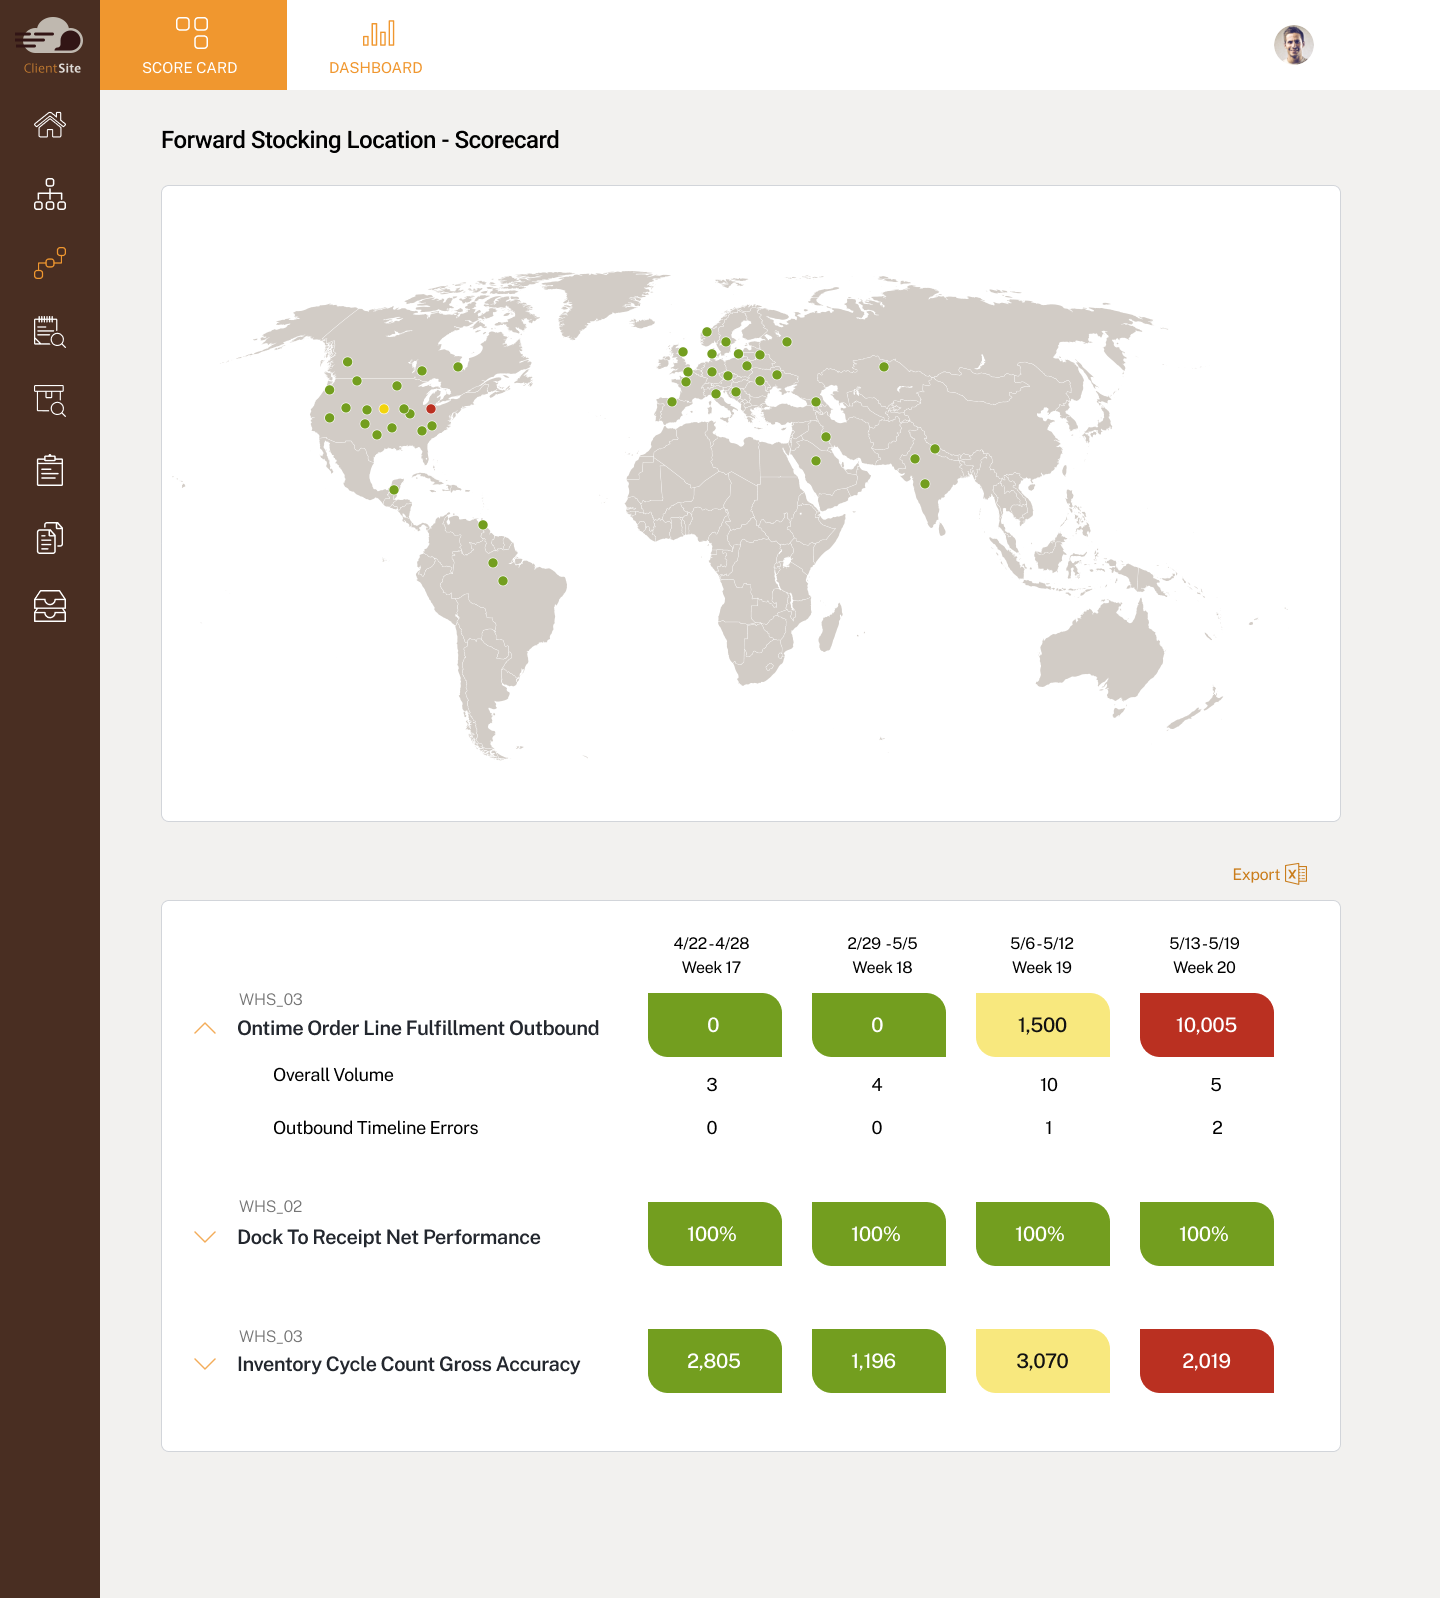
Forward Stocking Location
KPI Scorecard and Dashboard for selected FSLs
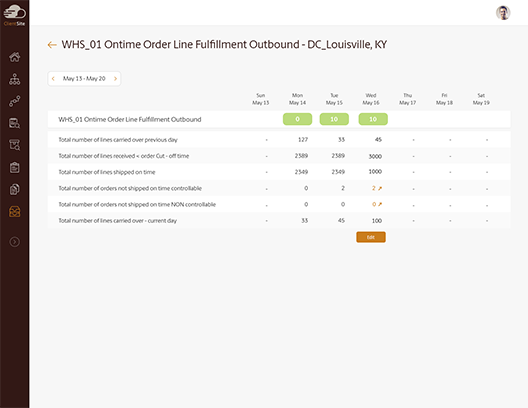
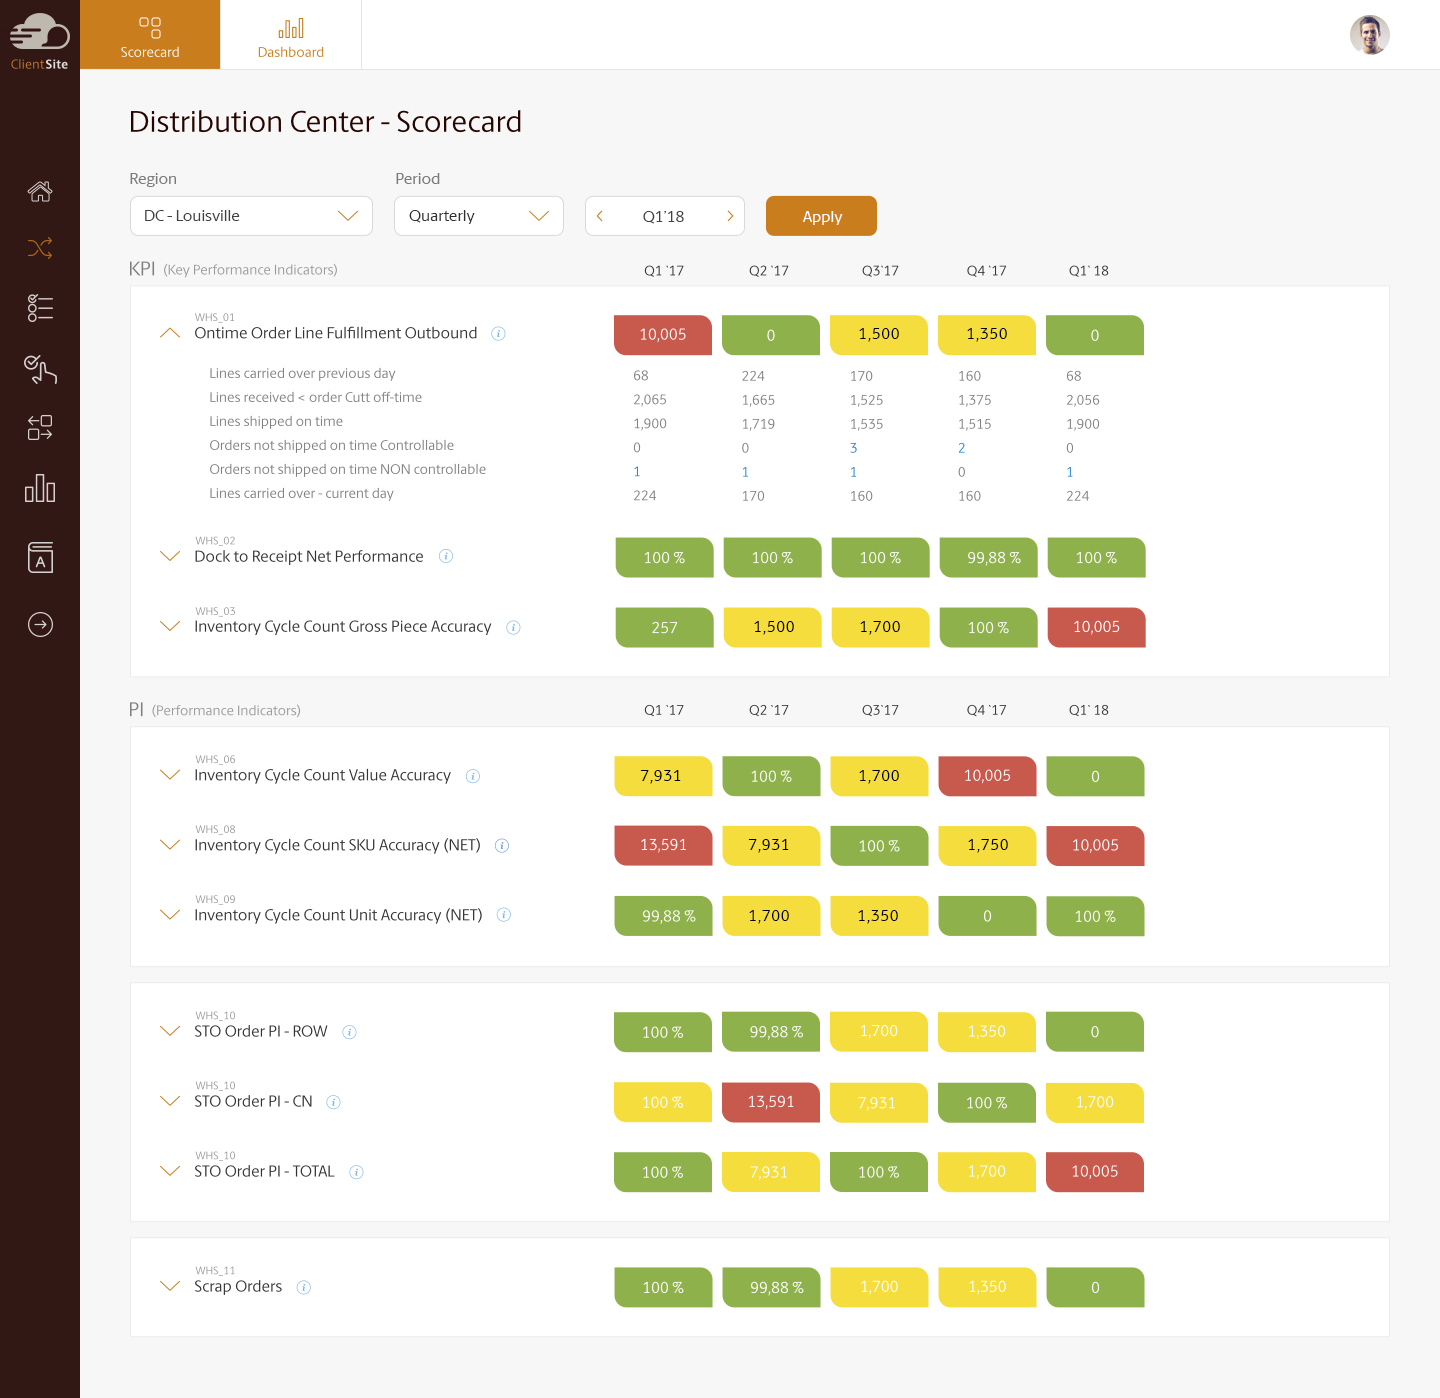
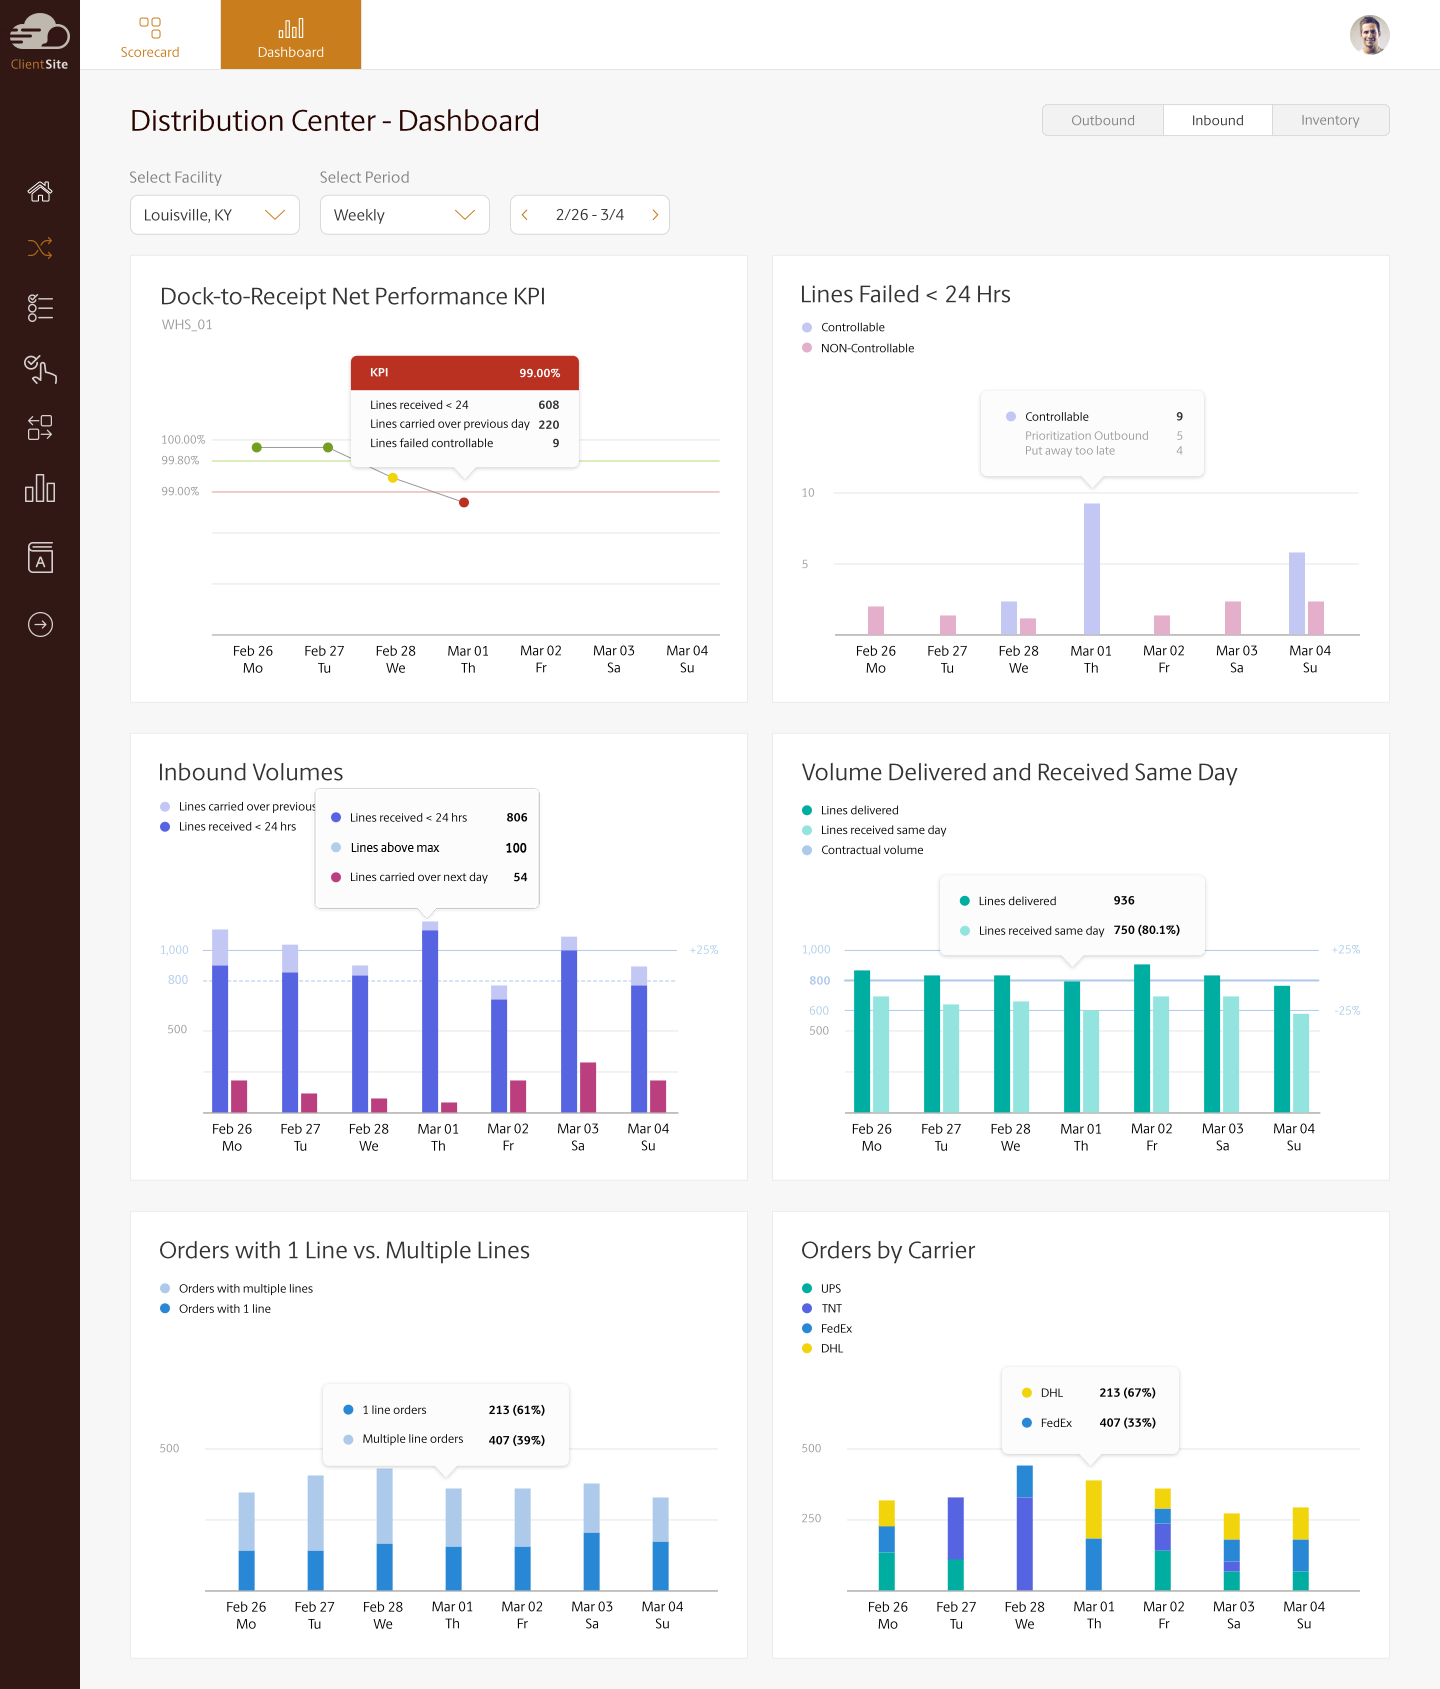
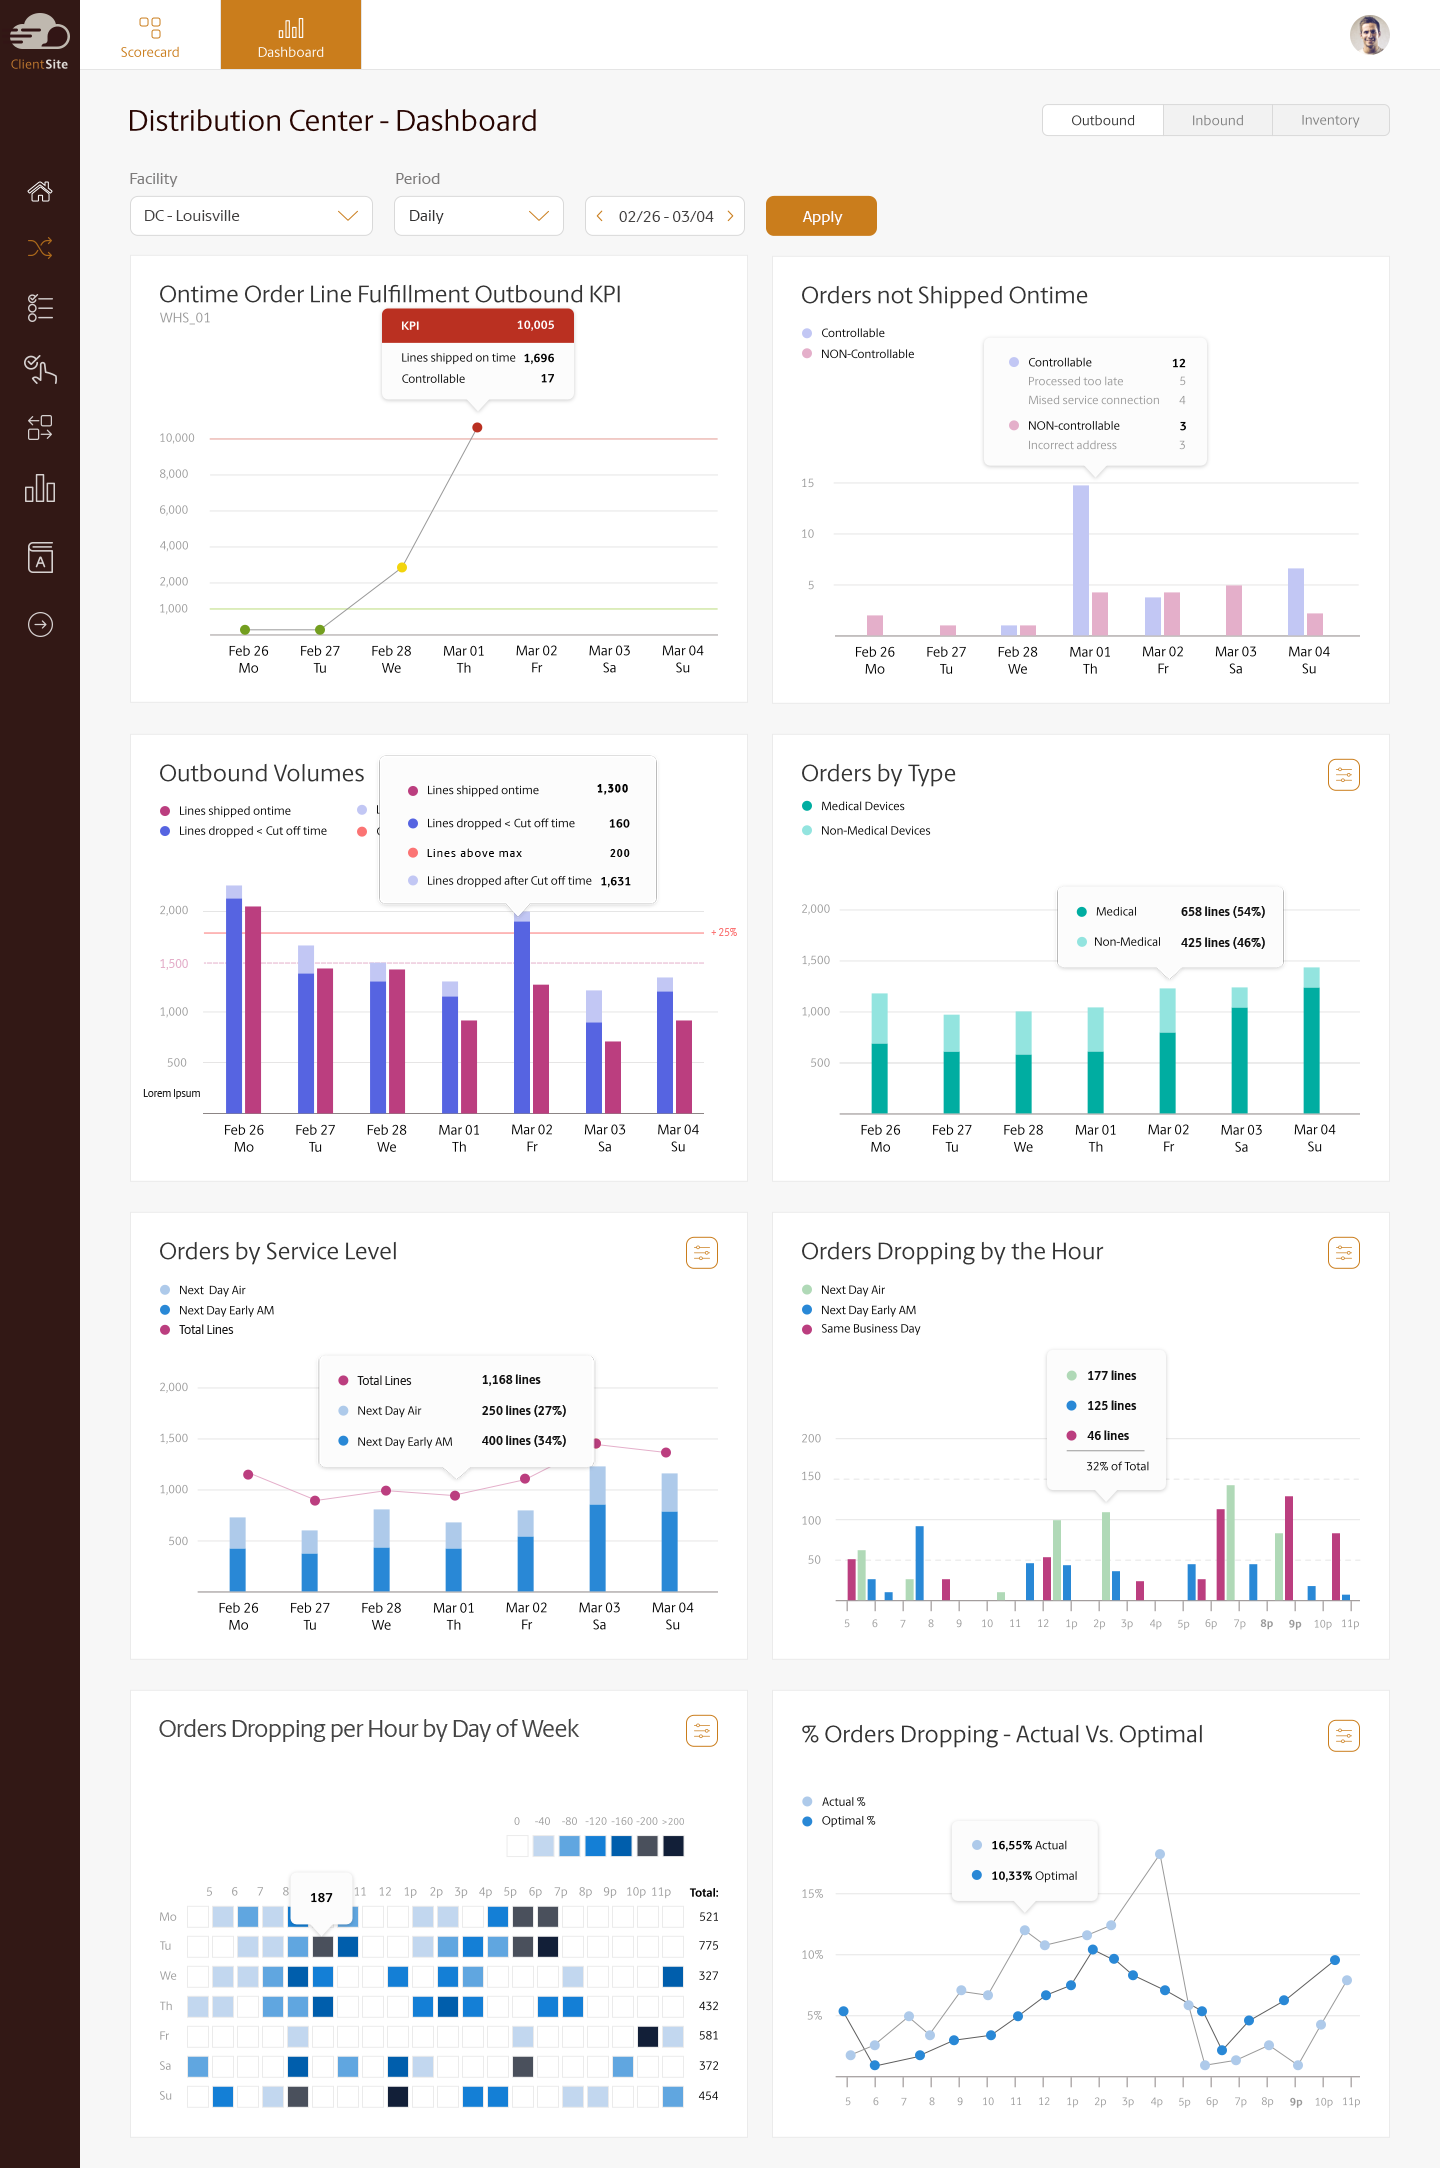
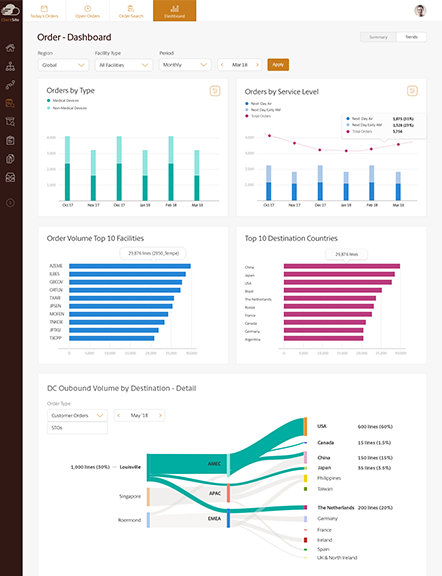
Distribution Center
KPI Scorecard and Dashboard for selected Distribution Centers
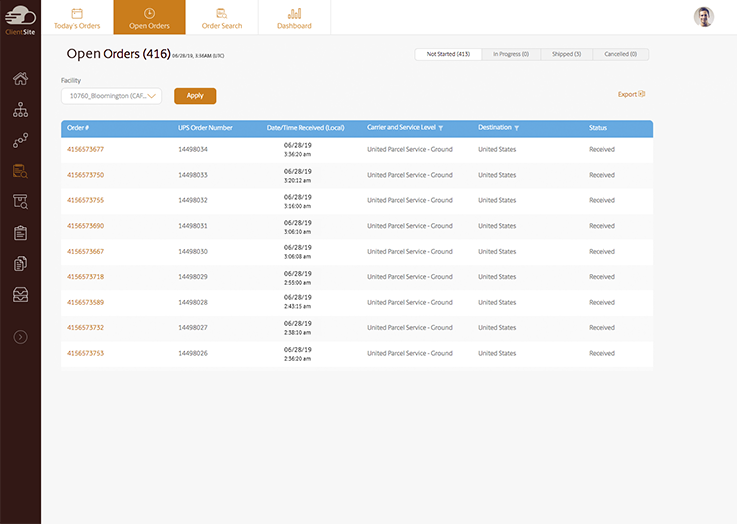
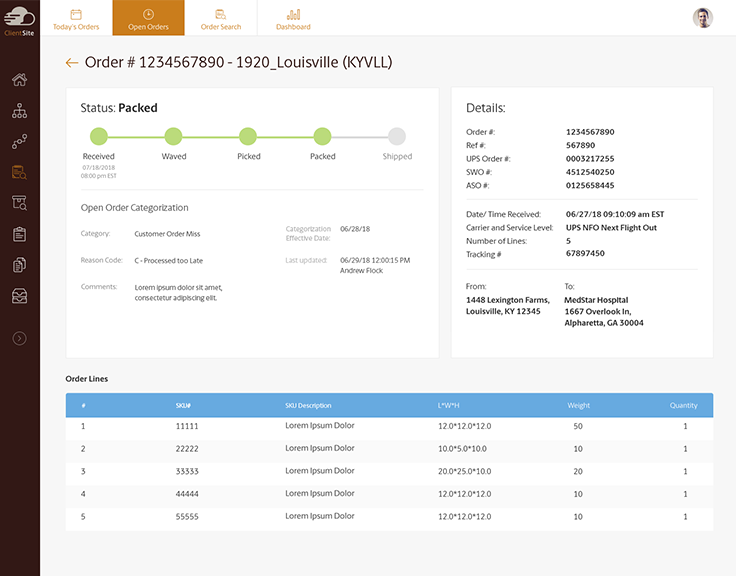
Orders
Display of all the orders in a selected warehouse, details of an order, and a strategic view of orders
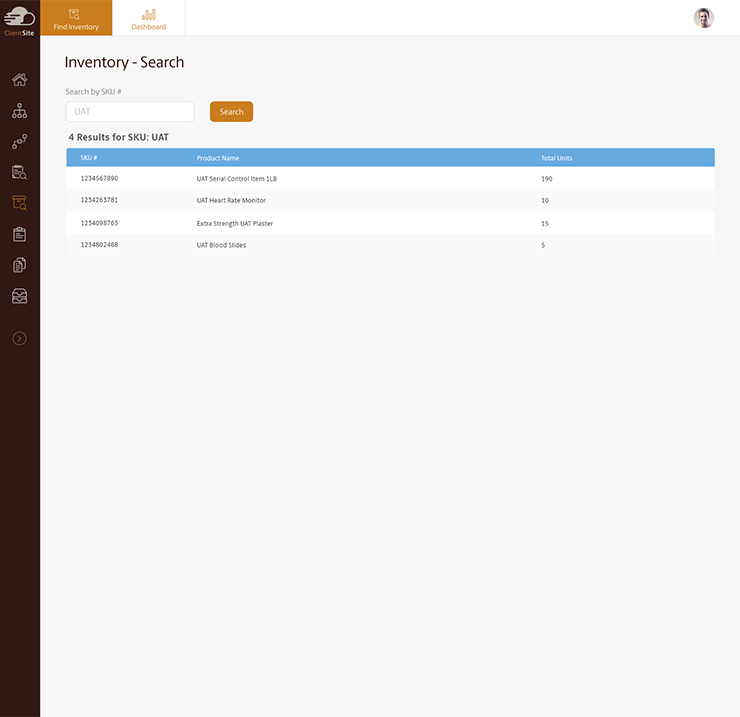
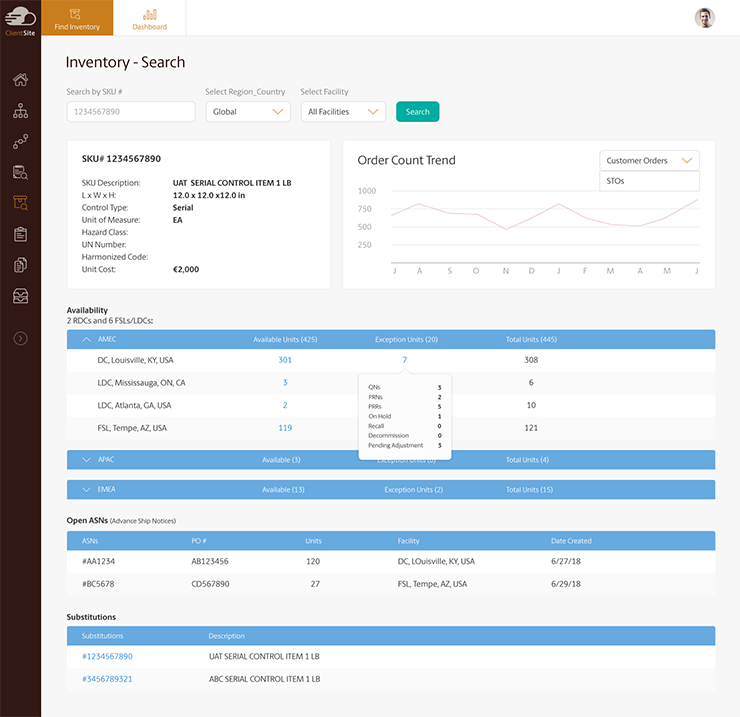
Inventory
Module that allows the user to search and view details for a SKU
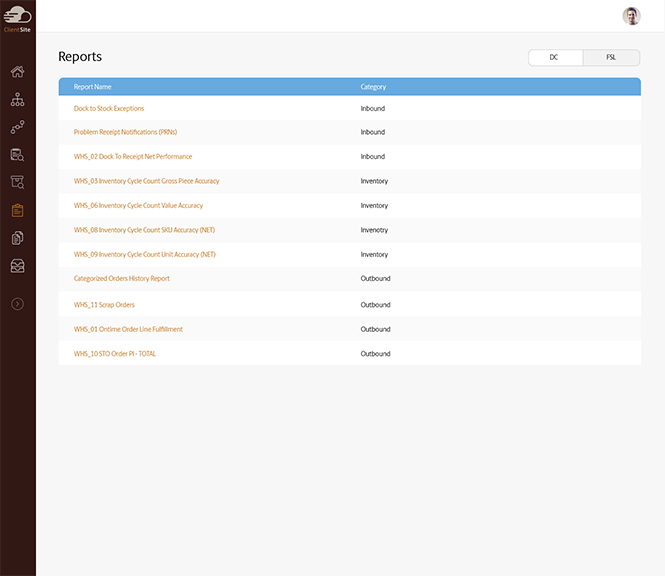
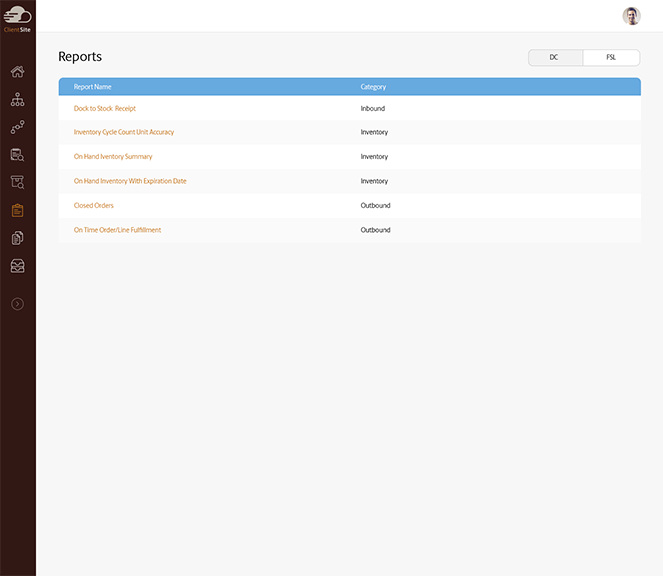
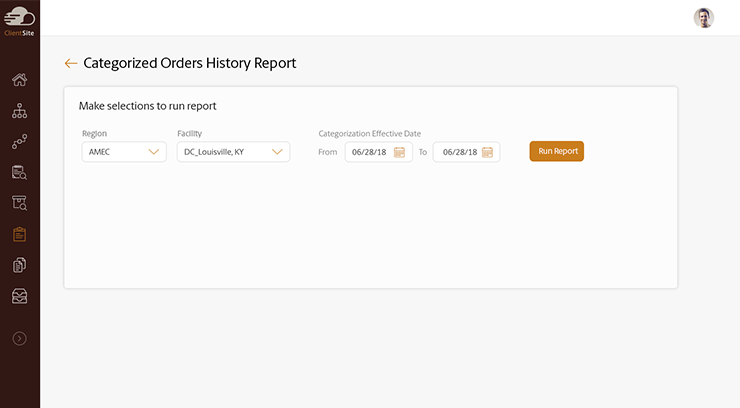
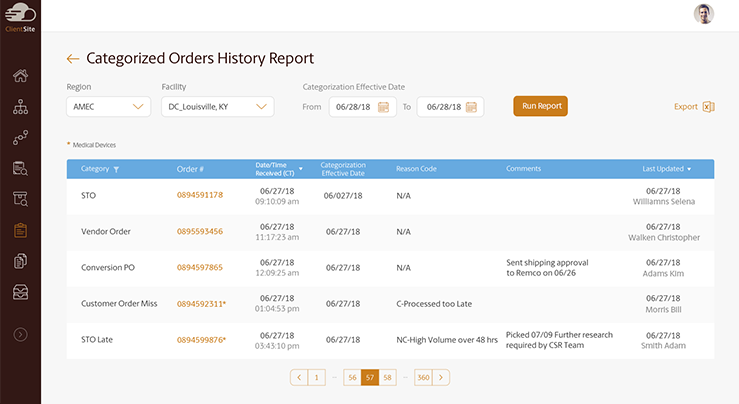
Reports
Listing of all the reports seperated by FSL and DC. User clicks on report and makes selection then hits run to view data
Data Collection
Section where a warehouse operator enters data points that calculates the score and displays on the FSL and DC KPI dashboard.